
Area 1: Place identity


To define the identity unique to islands, the first basic area of a habitability analysis is focused on two characteristics: their dynamic populations, and their position in seas and lakes, making them hard to reach.
The uneven presence of humans on islands makes them a different kind of place, aside from being surrounded by water. Islands can be almost empty and sleepy in winter but awake around the clock in summer with lots of people present.
It is misleading to simply count persons. The people of Manhattan spend most of the year’s 365 days in their hometown, a total of 595 million person-days, while their visitors typically stay 2,5 days, which adds up to 34 million person-days. Islands also have a third category of population: part-time residents. To more accurately understand human pressure, we must count the person-days for each of the three population types that stay on the island.
The island can have ten times as many people present in summer as in winter. Why is this important? Because island infrastructure has to be adaptive. The amount of monthly waste collected in the low season on Kökar is two small containers per month; in the high season, 16 containers. The volume of sewage is 2 m3 per day in January and 36 m3 per day in July.
“Island life is subject to the tyranny of distance”, says Professor Stephen A Royle in his “A Geography of Islands” (2001).
Islands with a fixed link lose their “islandness”. A journey over a bridge is fast, banal, and has little sense of adventure. It is not the same as sea travel to islands. To travel to and from our islands, we use ferries, of which there are 670 in Europe, whereof 206 in the Baltic Sea, 121 in the North Sea, and 344 in the Mediterranean.
In Scotland, 7 million passengers and 2 million cars were transported along 50 sea routes in 2015. Scotland has a Road Equivalent Tariff (RET) where the car ferry to an island and the piers are, in fact, parts of a flexible road over which cars and commercial vehicles can pass to and from islands. But there is a different rationale concerning ferries: paying a road tax entitles road drivers to drive anywhere on the road system. Taxation is used to construct and maintain roads. Roads go everywhere except for islands. If it were possible to build roads to islands, it would have been done. Islanders pay a road tax while being uniquely denied access to the road system without paying a substantial ferry surcharge. To be fair, the cost to the islander of the ferry crossing is related to the cost of travelling along an equitable length of road – which mainlanders can freely drive on.
Indicators in the Place identity area:
- (1) All-year population
- (2) Part-time residents
- (3) Visitors
- (4) Total population
- (5) Seasonal dynamics
- (6) Distance
- (7) Accessibility
- (8) Perceived distance
Indicator 1: All-year population
a Rationale
In biology and ecology, a population is a group of individuals within a species in a given area at a given time. The term is well suited to describe the human presence on an island. The Merriam-Webster dictionary defines population as “the whole number of people or inhabitants in a place”, or “the total of individuals occupying an area or making a whole”. Consequently, working with indicators 1-5, we will include all of the individuals who are, at times, occupying the island. In Indicator 1, we count the all-year residents.
b Definition
The current number of all-year residents of the island.
c Computation
The number of residents according to official statistics, corrected by the islanders themselves, given in both the number of individuals and the number of person-days. For small islands without a local administration, the data must be based on local knowledge.
| Year | No of residents | No of residents, counted in person-days (x 365) |
This indicator cannot be assessed on a four-grade scale. Some island populations are small, and others are large. Numbers are what they are and will be used in the following indicators and last, but not least, for indicator no. 45 – whether the population is shrinking or growing.
d Example
Porto Santo is Madeira’s little sister, a small island 42 km2 in size, 30 nautical miles northeast of Madeira. Porto Santo has its regional government under the auspices of the Madeiran regional government, which itself has semi-autonomic status within the Portuguese national system. Major policy decisions are made in Lisbon, but the Porto Santo council leads the local economic development.
The island has a permanent population of 5,158 people. However, the population can quadruple over weekends in summer. Until a recent influx of foreign retirees, the population was largely families living on the island for generations. Tourism, which is not overly dominant, gives jobs to all youngsters in the summertime but leaves half of them unemployed in winter.
| Year | No of residents | No of residents, counted in person-days (x 365) |
| 2021 | 5,158 | 1,882,670 |
References
- AdminStat Francia: Maps, analysis and statistics about the resident population (login required). 11.3.2022.
- Pleijel, C., Nordström, A.: Water Saving Islands, (2019), opens in PDF-format. p. 20, 40 and 62.
- Chiron, T.: Quel risque de pénurie d’eau sur les îles du Ponant? (2007) pp.73-86.
Indicator 2: Part-time residents
a Rationale
Many islands have part-time residents. They may work on the island but are not registered residents. Many of these are summer residents who have inherited or bought a property. Describing the part-time population is important to understand their impact on island society, infrastructure and local economy.
Many part-time residents pay real estate tax but no income tax to the island. They have no right to take part in local elections. They contribute to the local economy – part of the year. A dominant part-time population may put the society at risk of becoming two societies – one in winter and another in summer. A sound balance is desirable.
b Definition
Part-time residents are people who live on the island for part of the year. They often own property on the island. Part-time residents are also people who, on a long term basis, are renting a house in which they spend part of the year.
c Computation
(i) Number of part-time residents
(ii) Number of part-time residents counted in person-days with the help of average days they spend on the island (might be several sub-categories).
| Number of part-time residents | Average stay [days] | Total number of person-days |
d Example
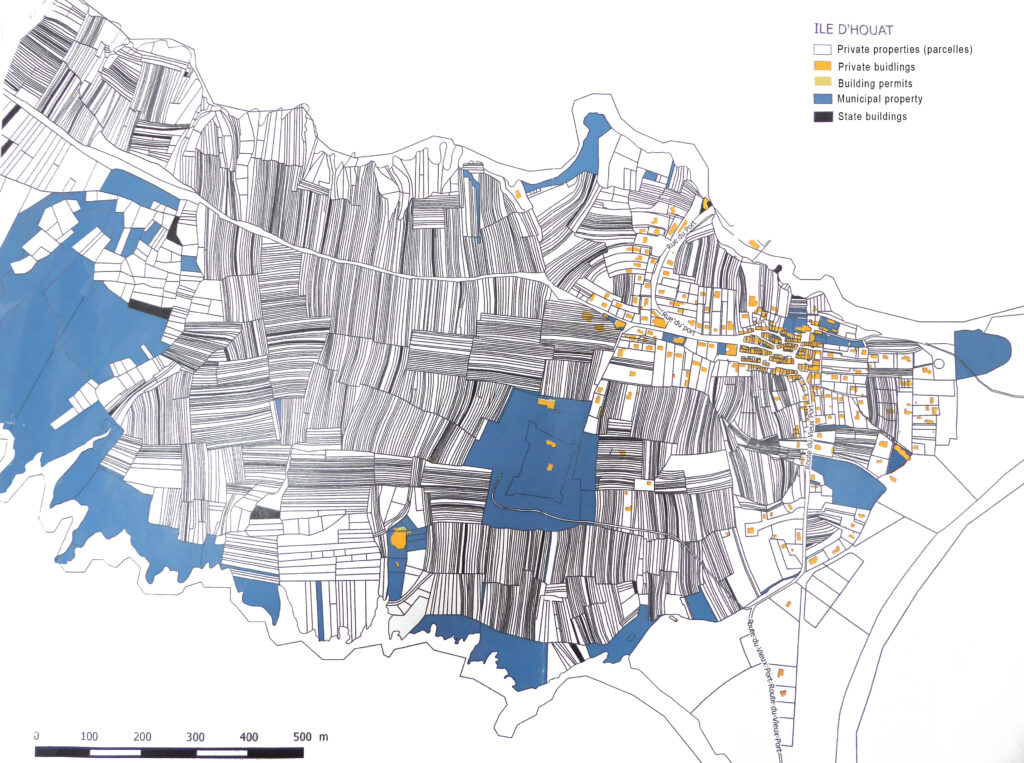
As can be seen on the map, land on the French island Houat is divided into many small plots. The number of these parcels is 1,118, almost all including a house. Approximately one hundred are homes belonging to all-year residents; the rest are owned by people who spend part of their time on the island.
According to European statistics, a house is typically occupied by 2,3 persons. The houses on Houat are occupied for about ten weeks a year, says Andrée Vielvoye, Madam Mayor of Houat. To grasp these numbers, we need to transform them into person-days.
Houses belonging to all-year residents: 105
Houses belonging to part-time residents: 1,118 – 105 = 1013
Part-time residents spend about 10 weeks on the island = 70 days a year.
Computation of part-time residents in person-days:
1013 houses x 2,3 persons x 70 days = 163,093 person-days
If we want to compare this to the all-year residents, we have to make the same calculation for them:
105 houses x 2,3 persons x 365 days = 88,148 person-days
| Number of part-time residents | Average stay [days] | Total number of person-days |
| Part-time residents 2,341 | 70 | 163,093 |
| All-year residents 242 | 365 | 88,148 |
Through the number of person-days, we learn that the all-year residents account for approximately half the amount of “the whole number of people or inhabitants in a place”, to cite Merriam-Webster.
Indicator 3: Visitors
a Rationale
Tourism is very important on islands. For many islands, money generated by the tourism industry makes up their primary contribution to the gross local economy.
The United Nations World Tourism Organisation (UNWTO) has developed an indicator of the seasonal pressure on the host regions and populations’ environmental and social resources. This is called the tourist-to-local ratio.
Andorra holds the world record with a tourist-to-local ratio of 36:1. Macau has 25:1 tourists to every local. Miami has 0.5 million inhabitants and receives 8.1 million tourists every year, which gives a tourist-to-local ratio of 16:1. Las Vegas has a ratio of 10:1 and Manhattan (also an island), with 1.63 million locals and 13.5 million international visitors annually, a ratio of 8:1.
Islands certainly follow this trend, and their tourist-to-local ratio can even outnumber those declared for Andorra or Manhattan. Houat (described in Indicator 2), with 84,500 yearly visitors and a resident population of 242, has a tourist-to-local ratio of 349:1. Hven, a Swedish island with 130,000 yearly visitors and a resident population of 528, has a ratio of 246:1. That is seven times more than Andorra, holder of the official world record, and sixteen times more than Manhattan.
The UNWTO ratio counts persons, not person-days. For islands having mostly day-trippers or visitors staying for just one night, the result is truthful. Islands having a larger share of visitors staying several days, or a whole week, might find the ratio is an underestimate of the local tourism pressure.
b Definition
(i) Yearly number of visitors, preferably per category, counted both in persons and in person-days, during high and low seasons.
(ii) The tourist-to-local ratio.
c Computation
(i) Yearly number of visitors
| Category | Length of stay [days] | High season (x days) [persons/day] | Low season (x days) [persons/day] | Number of persons | Number of person-days |
| Staying overnight | |||||
| Day trippers | |||||
| On cruise ships | |||||
| Sum |
ii) Tourist-to-local ratio
| Number of tourists | Number of residents | Ratio |
| 1 | 2 | 3 | 4 |
| A ratio of more than 1:100 or less than 1:5 | A ratio of 1:50-1:100 | A ratio of 1:10-1:50 | A ratio of 1:5-1:10 |
d Example

Capri is a mountainous island 25 nautical miles off Naples in Italy. The island has an area of 10.4 km2. There are two municipalities on the island, Capri with 7,052 residents and Anacapri with 6,684 residents.
Capri is visited by 2.3 million people a year, with up to 20,000 visitors per day during the summer. About 70% are day-trippers from either Naples or Sorrento.
On a relatively small area (Capri is 400 hectares and Anacapri is 636 hectares), there are 59 hotels, three residences, 30 furnished rooms, 104 rental vacation houses, 93 B&Bs, and a holiday farm. This means that on 1,036 hectares, there are 209 accommodation facilities, almost five accommodations per hectare. There are also 124 restaurants, 15 bathing establishments, 14 nightclubs, and nine spas.
In Capri, the high season is four months of the year, with approximately 4000 daily visitors staying overnight. During the low season (200 days), 500 daily visitors stay overnight. Cruise ships bring about 500 persons a day to Capri during the high season.
Being super famous has led Capri to an ultra fast tourism. Visitors want to have “been there, done that” which rarely expands over more than one day.
High season:
160 days x 4,000 persons/day = 640,000 persons
Low season:
200 days x 500 persons/day = 100,000 persons
Total amount of persons staying overnight during one year:
640,000 + 100,000 = 740,000 persons
| Category | Length of stay [days] | High season (x days) [persons/day] | Low season (x days) [persons/day] | Number of persons per year | Number of person-days per year |
| Staying overnight | 1 | 4,000 | 500 | 640,000 + 100,000 | 740,000 |
| Day trippers | 1 | 12,000 | 1,000 | 1,920,000 + 200,000 | 2,120,000 |
| On cruise ships | 1 | 500 | 80,000 | 80,000 | |
| Sum | 2,940,000 | 2,940,000 |
The tourist-to-local ratio of Capri is calculated by dividing the total number of tourists by the total number of inhabitants of the island: 2,940,000 / 13,736 = 214,04.
| Number of tourists | Number of residents | Ratio |
| 3,680,000 | 13,736 | 214:1 |
Capri has a UNWTO tourist-to-local ratio of 214:1 (pre-COVID) and scores 1.
Indicator 4: Total population
a Rationale
We have learnt that islands, besides their resident population, have important numbers of part-time residents and a huge influx of visitors.
The total population of the island includes the permanent residents, the part-time residents and the visitors. “Population” is a word borrowed from biology and ecology: a group of individuals of a species present in a certain area at a certain time. The term fits well when we now have to count the entire human presence on the island, not just the persons written on the island.
We want to count the entire population because the island’s water and food supply, energy system, sewer lines, treatment plants, recycling and removal of waste, road network, ports, ferry capacity, public transport, legal system, health care, telephone and IT systems and more need to be dimensioned to cope with the real number of people present.
To understand the total human pressure on an island per year, we will now add all the person-days.
b Definition
Total human presence on the island compared to the official number of residents.
c Computation
| Category | Persons | Person-days |
| All-year population (Indicator 1) | X | X x 365 |
| Seasonal population (Indicator 2) | Y | Y x days/year |
| Visitors (Indicator 3) | Z | Z x days/year |
| Sum |
If you want to compare the official number of all-year residents to the total population (i.e., full-time residents + part-time residents + visitors), giving the overall human pressure, you have to divide the obtained sum by 365.
| 1 | 2 | 3 | 4 |
| A ratio of 4:1 or more | A ratio of 3:1 | A ratio of 2:1 | A ratio of 1:1 |
d Examples
In this example, we use the information on the islands Porto Santo, Houat, and Capri, with some information obtained from indicators 1, 2, and 3.
| Island | Category | Persons | Days | Person-days | Equivalent to persons a year (/365) |
| Porto Santo | All-year population | 5,158 | 365 | 1,883,000 | |
| Part-time population | 25,000 | 60 | 1,500,000 | ||
| Visitors | 59,900 | 5.9 | 353,000 | ||
| Sum | 3,756,000 | 10,290 | |||
| Houat | All-year population | 242 | 365 | 88,330 | |
| Part-time population | 2,571 | 75 | 192,855 | ||
| Visitors July & Aug | 600 | 60 | 36,000 | ||
| Visitors June & Sept | 400 | 60 | 24,000 | ||
| Visitors rest of the year | 100 | 245 | 33,000 | ||
| Sum | 374,186 | 1025 | |||
| Capri | All-year population | 13,736 | 365 | 5,013,640 | |
| Part-time population | Unknown | ||||
| Visitors | 2,280,000 | 1-2 | 2,860,000 | ||
| Sum | 7,873,640 | 21,572 |
On Porto Santo, the total human pressure is twice as heavy as the official population number (10,290 instead of 5,158), an indicator value of 3. For Houat, human pressure is four times higher (1,025 compared to 242), an indicator value of 1, and for Capri, it is almost double, 21,571 instead of 13,376, an indicator value of 3.
However, these numbers do not give the whole story about human pressure, as tourists consume much more water and energy per person and day than residents do. Also, the pressure on the island’s infrastructure and transport system is not evenly distributed over the year but concentrated on the summer season. We will examine this in the following indicator, number 5.
Indicator 5: Seasonal dynamics
a Rationale
Having counted the total population of an island, including every person who spends time there, we are now ready to describe the dynamics: the seasonal shifts in population numbers.
Many islands have a significant number of part-time residents, and many have a lot of visitors. These two categories are different from the all-year residents in one important aspect: while all-year residents live on their island during the winter and summer, the part-time residents and visitors spend time on the island mainly during the summer season.
Every individual uses the infrastructure on the island: we all drink water, shower, eat, produce garbage and sewage, use electricity and wi-fi, move around with cars and boats and bikes, need healthcare, and the like. To deepen our understanding of the habitability of an island, we need to show the dynamics of seasonality since it affects the local economy, the pressure on nature, culture, and the socioeconomics of the island. We will do this by describing summer highs and winter lows, which may appear as an oversimplification. Still, it will provide us with an indication of the peak load of the island infrastructure systems.
b Definition
The difference in human presence on the island in the low season compared to a day in the high season.
c Computation
The total human presence a day in the low season, divided by the total human presence a day in high season, six months apart. January 15 and July 15 are suitable in Northern Europe; February 15 and August 15 in Southern Europe, to adjust with regional holidays.
| 1 | 2 | 3 | 4 |
| A ratio of more than 1:25 | A ratio of 1:11-1:25 | A ratio of 1:4-1:10 | A ratio of 1:1-1:3 |
d Example

Holmön, an island with an area of 22.5 km2, is situated in the north of Sweden, 10 kilometres from the mainland. Holmön is said to be the sunniest island in Sweden. The island is served daily by a ferry, a 40-minute trip. In winter, a bus drives to the island on an ice road.
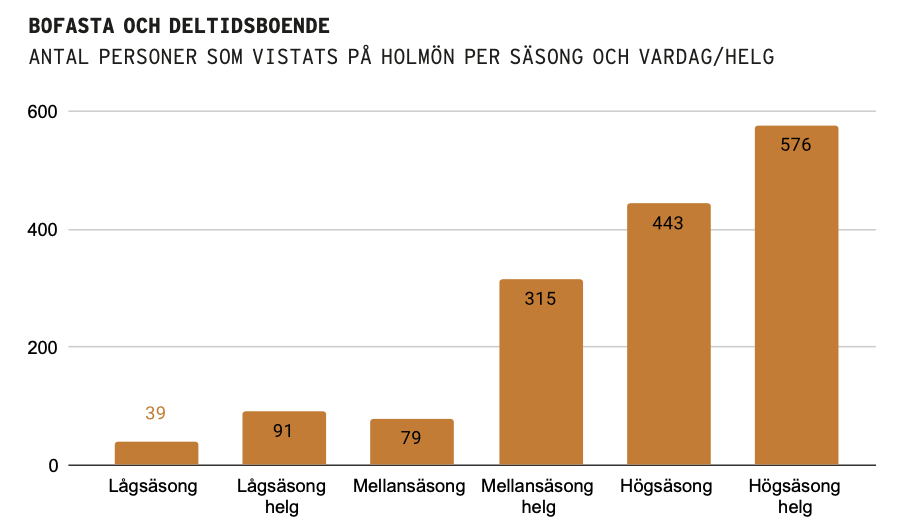
Holmön was the smallest municipality in Sweden from 1925 to 1974. Twenty years ago, the number of residents was almost 100, and over 400 in 1945. Today, Holmön has 60 registered residents, but not all of them spend all the year on the island. About 580 persons, primarily descendants, grandchildren, and relatives to people on Holmön, are part-time island residents. They mainly spend their time on the island during the summer and at the weekends all year round (diagram 1).
The islanders have cleverly computed and organized their population in different categories, including all-year residents, part-time residents with two homes (one in town and one on the island), holiday all-time residents, holiday half-year residents, holiday part-time residents, and visitors. Diagram 2 illustrates how the different population categories inhabit the island, overlapping each other.
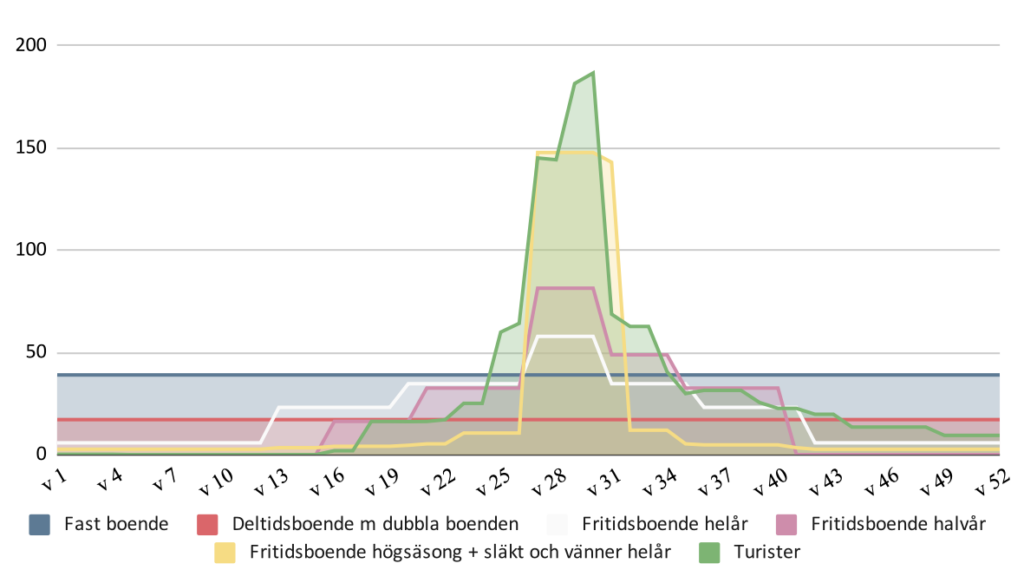
Blue = All-year residents. Red = Part-time residents with two homes. White = All-year holiday residents. Pink = Half-year holiday residents. Yellow = High season residents. Green = Tourists.
The diagrams show that 39 persons inhabit Holmön during the low season and 576 persons during weekends in the high season. The ratio for Holmön calculates as:
576 / 39 = 14,8, thus 1:15.
The pressure on the island’s systems on a weekend day during summer is 15 times higher than on a day during winter. This would give Holmön a value of 2.
Whether the water resources, sewage systems, energy provision, wi-fi, ferries, harbours and roads, fire brigade, and presence of doctors and nurses on Holmön can handle such shifting demands is a question we will discuss later on. It is as if Manhattan, with a nighttime population of 1.63 million, would have a daytime population of 24.5 million, or if Helsinki, with a resident population of 632,000 on a winter day, would have 9.5 million people in town on a summer day.
References
Indicator 6: Distance
a Rationale
The distance to an island may seem simple to measure. Still, in reality, it is more tricky and calls for three interrelated indicators: distance (Indicator 6), accessibility (Indicator 7), and perceived distance (Indicator 8). One leads to another, and the purpose of this is to understand how distance affects the habitability of your island.
The geographic distance to an island can be defined by either the stretch of water dividing it from the mainland or the distance from the island’s main port to the main port on the mainland. When judging the habitability of an island, it seems reasonable to look at the travel distance instead, as it sets the scene for understanding accessibility (indicator 7) and the human geography of the island.
b Definition
From a distance point of view, Baldacchino and Pleijel (2015) propose five types of European islands:
| Category | Type | Definition |
| A | Bridged | Islands with fixed links (bridges, causeways, tunnels) to their respective mainland. Typically located inside a town, a lake, a lake district, or a river. |
| B | Coastal | Near the shore of the mainland, close enough to be associated with the coastal area. Within sight, this side the horizon[1], well within VHF range[2]. Often part of a mainland community, municipality, or county |
| C | Off the coast | Out to sea, off-lying islands far away from land, hardly visible, located less than 12 nautical miles (or 22.2 nautical kilometres) from the mainland coast. |
| D | In the high seas | Offshore, faraway islands located more than 12 nautical miles (or 22.2 nautical kilometres) from the mainland coast, outside territorial waters (12 nm) |
| E | Overseas | Islands located outside or beyond the geography of the European continent. |
[1] Standing at 1.70 m height, the horizon is roughly 5 km away
[2] A small boat antenna at sea level has a VHF range of about 5 nm ~9 km
c Computation
| A | B | C | D | E |
| Bridged | Up to 5 km from the mainland, unbridged | 5–50 km from the mainland | More than 50 km from the mainland | Outside the European continent |
d Examples
Type A
Mont-Saint-Michel in France is a special place. It is a famed place, inhabited by 44 people, with 2.5 million visitors annually (a tourist-to-local ratio of 5680:1). Mont-Saint-Michel has a strong island identity, although it becomes an island only twenty times a year when very high tides roll.
Type B
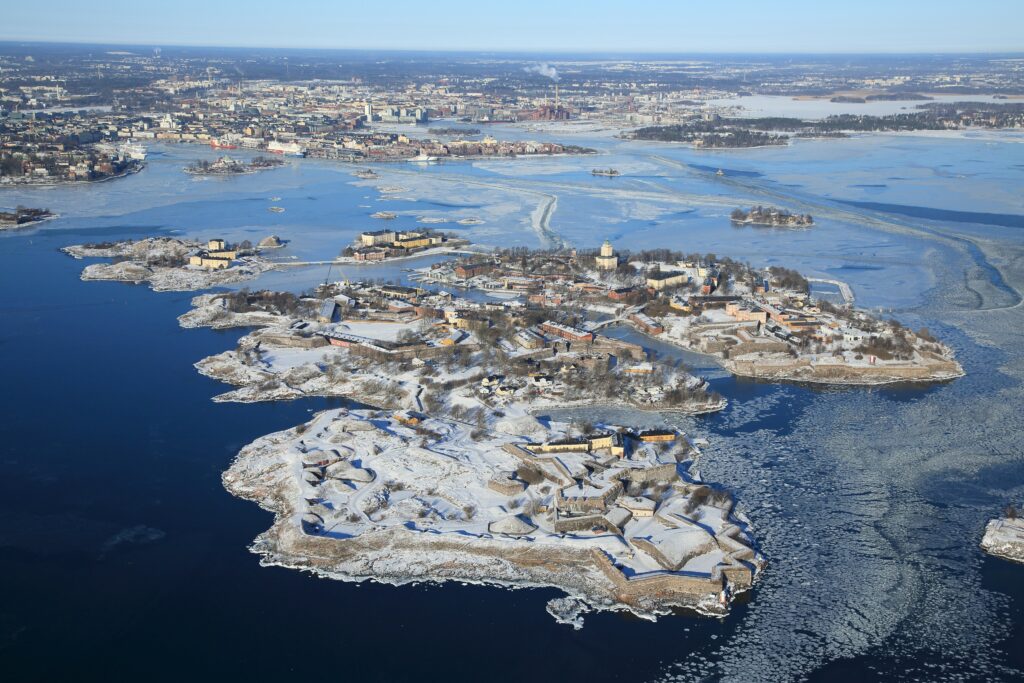
Suomenlinna (Sveaborg in Swedish) is one of the largest sea fortresses in the world, located at the entrance to Helsinki. The building process started in 1748 when Finland was part of Sweden and is the most expensive defence project in Swedish history. Suomenlinna has been on the UNESCO World Heritage List since 1991. About 840 people live on the island, and it has a grocery shop and a primary school. The number of yearly visitors is about 670,000, mainly daytrippers. The distance to Suomenlinna is about 1 kilometre from the city centre of Helsinki. It is served more than ten times a day by ferries and water buses. The journey takes about 15 minutes.
Type C
Capri is located 5 kilometres off Punta Campanella on the Sorrento peninsula in Italy. However, the bulk of marine traffic heading for Capri departs from the port of Naples and calls at Marina Grande, a 33 kilometres journey, which takes roughly an hour. The travel distance puts Capri in category C.
Type D
Lastovo, at 47 km2, is a big island far out in the Adriatic Sea, the most remote of the Croatian islands. Lastovo has 792 persons living on the island all year round, but the human pressure on the island’s infrastructure is the equivalent of a resident population of 1,509 people.
The distance to Lastovo from the mainland port of Split is in a straight line of 90 km and by ferry, 207 km. There is both a ferry and a catamaran line from Split every day, with stops on Korcula and Hvar along the way. It takes five hours from Split to Lastovo with the ferry and three hours with the catamaran. Lastovo is thus a category D island.
Type E
In the EU context, “Ultra-peripheral regions” are a group of territories belonging to various member states located far from the European continent. They include the French Overseas Départements (Martinique, Guadeloupe, Réunion, French Guyana, and recently added Mayotte), the Canary Islands (Spain), and Madeira and the Azores (Portugal).
References
Indicator 7: Accessibility
a Rationale
While distance is a geographical feature, accessibility is a socio-technical factor based on mode(s) of transport, travel trip schedules, travel costs, waiting/travel/transfer time, travel considerations for disabled persons, and distance in length.
Islands with large populations offer many vital services, such as healthcare, education, administration. Coastal islanders may commute daily. For off-coast islanders, it is more difficult to access service, and it can be almost impossible for islanders on islands in the high seas to access service every day. Smaller islands in archipelagos often face double insularity (with several ferry connections), which creates handicaps incomparable to any situation on the mainland.
b Definition
The degree of access to services on a 4-grade scale, from high to low access.
c Computation
| 1 | 2 | 3 | 4 |
| Access to another destination demanding an overnight stay | Access to another destination is possible several days a week, without an overnight stay | Access to a destination possible in the daytime and in evening, without an overnight stay | Local access |
Total rating divided by the sum of applicable answers. Open the table (in pdf-format) by clicking here. Feel free to remove those that are not applicable!
d Example

Shapinsay is one of the islands of Orkney, north of the Scottish mainland. The island has a population of just over 300. There is a primary school, a community centre, which doubles as the Headquarters of the local Development Trust, a shop, a post office, a medical centre with part-time GP coverage and a nurse practitioner in post, and a church.
To get to Shapinsay, you first need to get to Kirkwall. You can do this by air directly to Kirkwall airport or by sea from the Scottish mainland with Pentland Ferries from Gills Bay to St Margaret’s Hope or Northlink Ferries from Scrabster the Scotto Stromness (both just a 20-30 minute drive from Kirkwall). If you are not keen on driving the whole way, there is a Northlink ferry that leaves direct from Aberdeen to Kirkwall. The m/v Shapinsay, commissioned in 1989, serves the island with six departures daily from Kirkwall, a 9 kilometre (25-minute) crossing.
In the Scottish Index of Multiple Deprivation (SIMD), Shapinsay falls into Decile 4, within the top 40% of most deprived areas in the nation. Under the Geographical Access domain, Shapinsay is within the top 2% of most deprived areas in Scotland, at 146 out of the 6,976 data zones. Regarding housing and income, Shapinsay scores low but compares positively against other areas nationwide in terms of health, education and skills, and, particularly, crime.
In 2022, the residents of Shapinsay formed the Shapinsay Development Trust. They erected an island turbine that is now their cash cow – bringing in up to £5,000 a day from the electricity they sell to energy companies. Some of these funds pay off the loan from the bank; the rest is invested in the community, such as an out-of-hours ferry link to Kirkwall, which runs twice during the evening and on Sunday mornings in the summer. The ferry allows residents to attend evening classes, evening work, Kirkwall Grammar School parent evenings, cinema, evening meals in restaurants, and many other things.
What accessibility to services do people on Shapinsay have? The below compilation is based on the Shapinsay Community Action Plan, the Scottish Index of Multiple Deprivation, a field study by Christian Pleijel back in 2012, and a visit by ESIN in 2017.
In the picture below you see a part of the table and how it was used in Shapinsay. The whole table is available in pdf-format by clicking here.
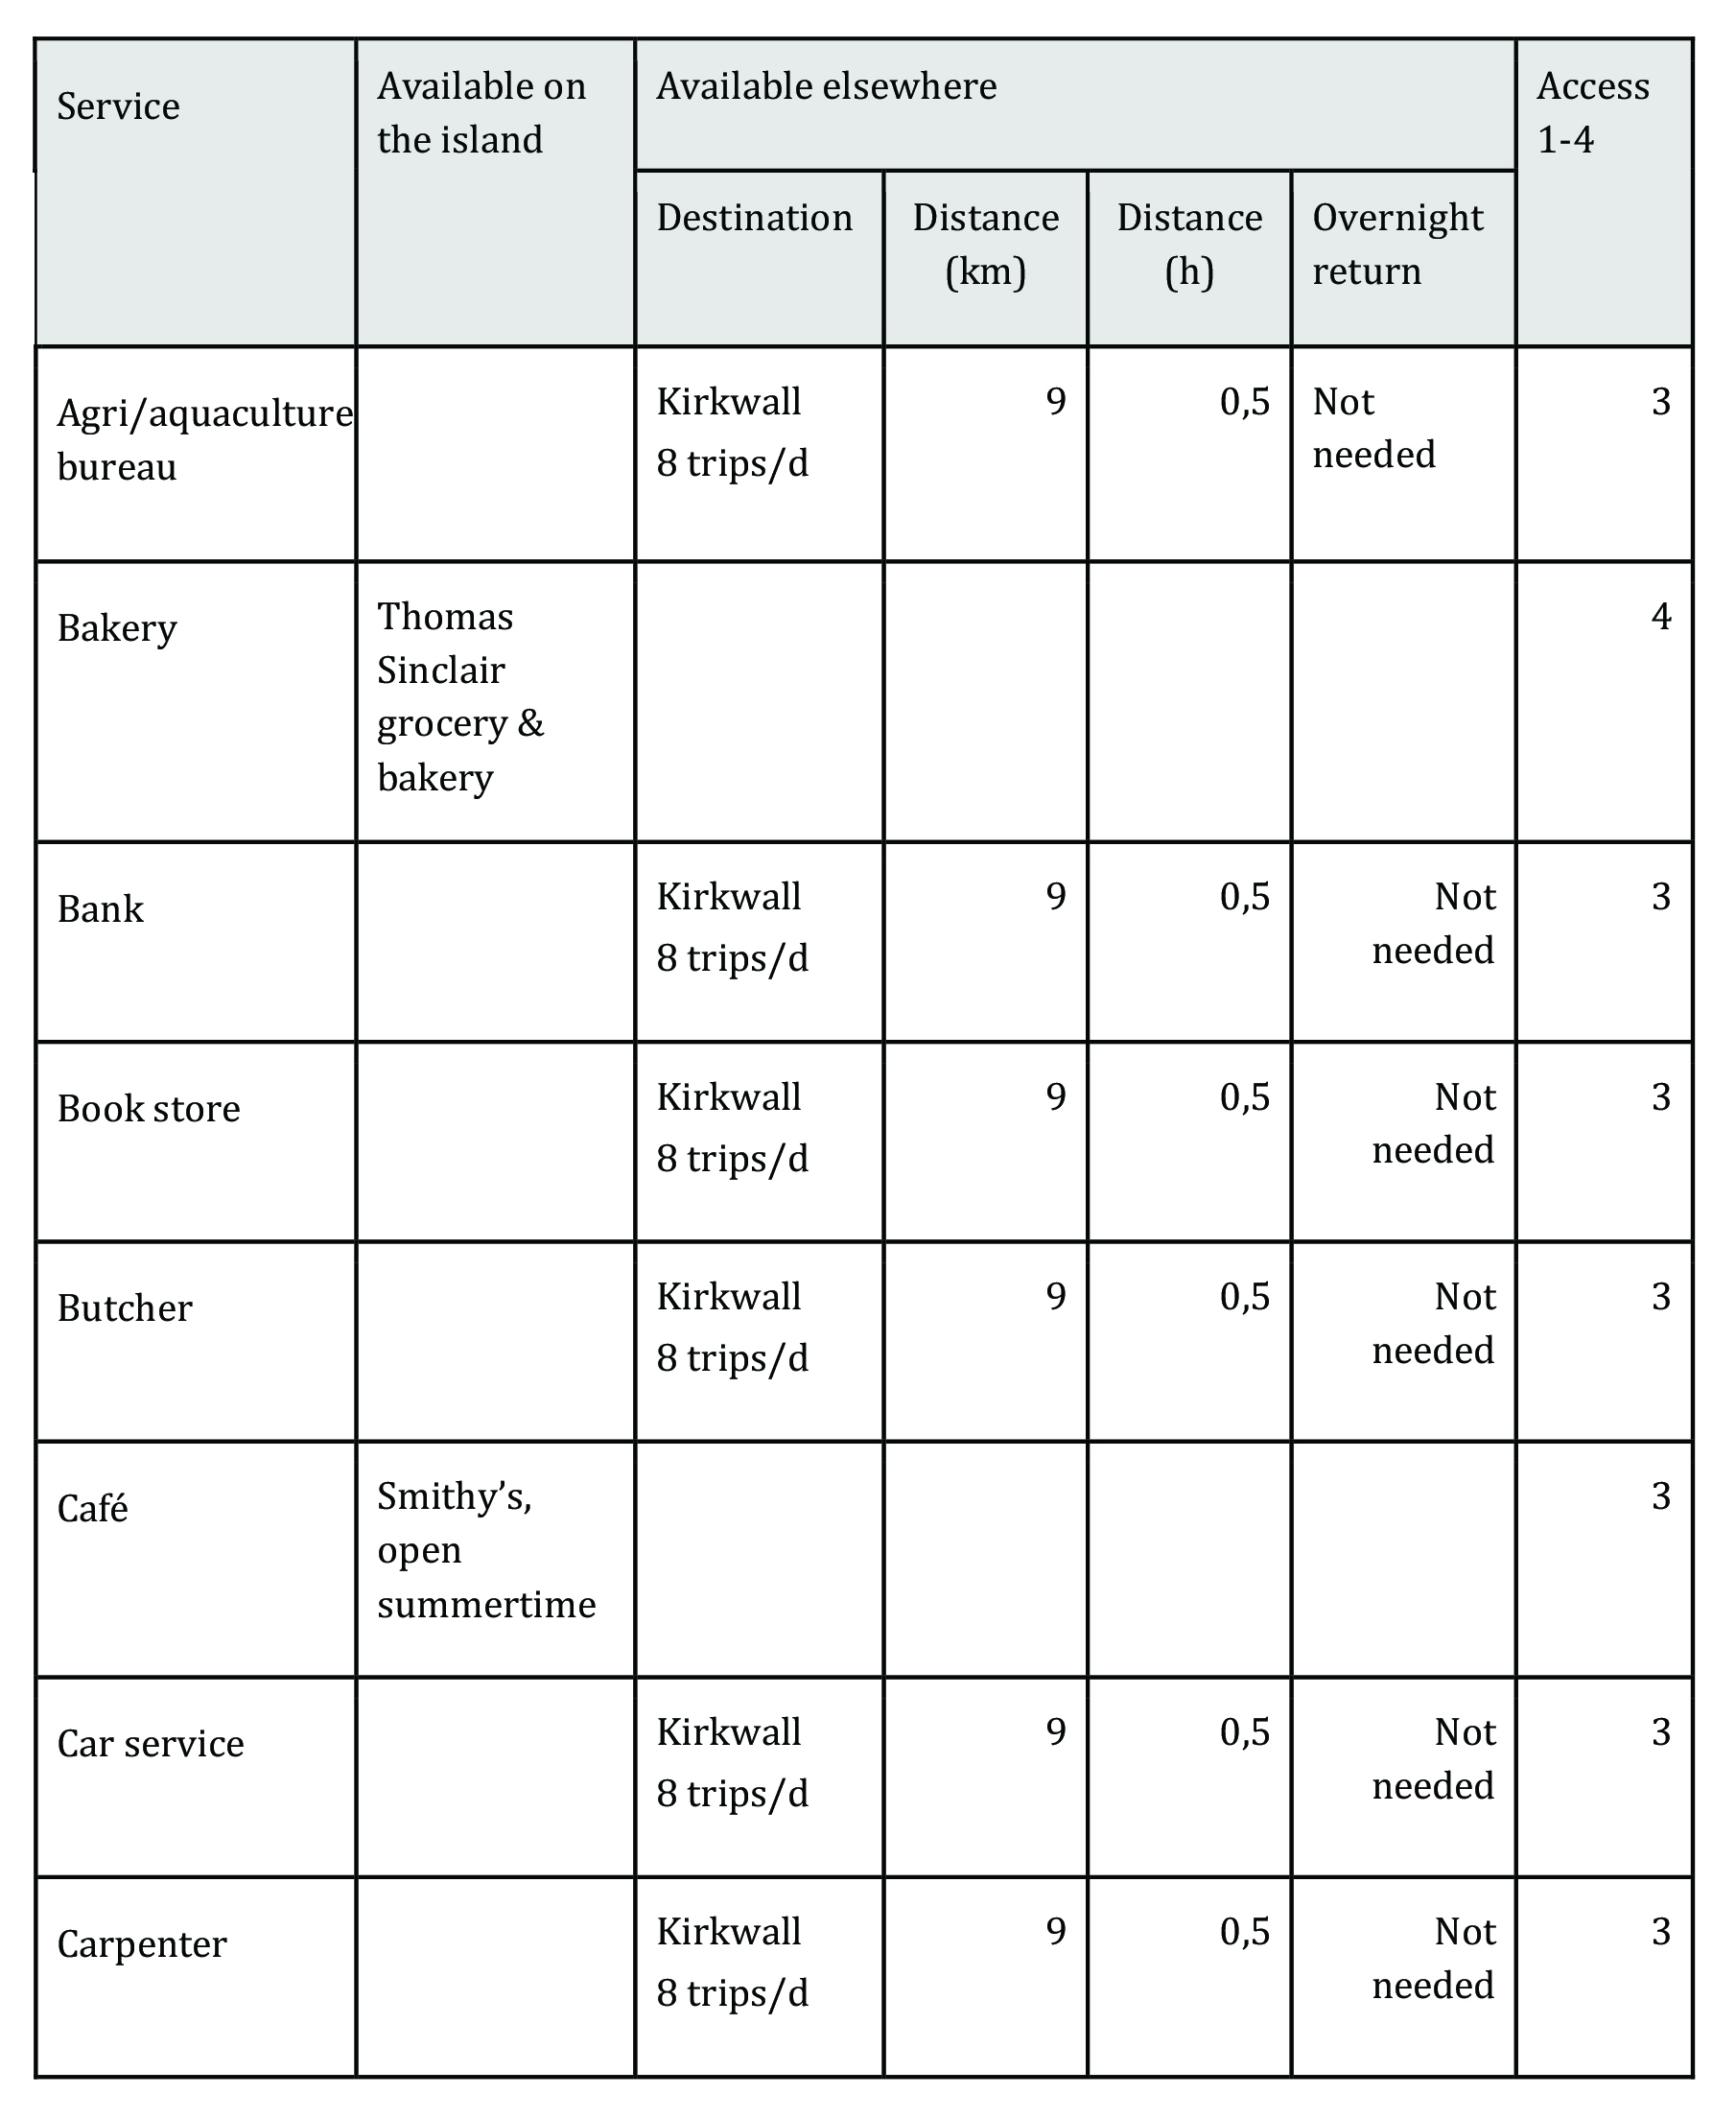
The rating of Shapinsay is 149/46 = 3.2, which gives a value of 3. This is much owed to the out-of-hours ferry, which has transformed Shapinsay from rating level 2 to level 3.
References
- Shapinsay Community Action Plan. Research Report. Shapinsay Development Trust 2020-2025. Opens in PDF-format.
- SIMD. Scottish Index of Multiple Deprivation.
Indicator 8: Perceived distance
a Rationale
The identity of an island and the image of an island are two sides of the same coin. Identity is who you are; image is how others see you. This fits nicely into the concept of distance. One side is the actual distance as the islanders know it; the other is how strangers perceive distance.
Ferries are a slow means of transportation, moving at an average speed of 18 knots (33 km/h). Catamarans can make 25 knots (46 km/h), a cable ferry is pulled at 4 knots (7 km/h). They all sail more slowly if they find themselves in choppy swells. A subway train makes 35 km/h, including stops. With a car, you are accustomed to travelling at 70-90 km/h. Trains make one or several hundred km/h, and aeroplanes fly at around 800 km/h. If we compare the speed of aeroplanes with that of mediaeval ships (sailing at an average speed of 10 knots), the world is now 80 times smaller than the 14th century.
Visiting an island, the combined effects of isolation, a dedicated and maybe previously unexperienced journey over water, leaving the safety of the mainland, and the unusually long time even a short passage takes makes the island seem remote. Simply put, the distance from Valencia to Menorca is 320 kilometres and takes 9.5 hours, while the distance from Valencia to Madrid is 360 kilometres and takes 3.5 hours. From Valencia, Menorca is thus perceived as being much more distant than Madrid. The same goes for Turku, Finland, situated 167 kilometres from Helsinki, the capital of Finland, and 171 kilometres from the Åland Islands. The motorway takes you from Turku to Helsinki in 2 hours, while the journey to Mariehamn, the regional capital of the Åland Islands, takes 5 hours.
One way to describe this is to use isochronic (iso = equal, chrone = time) maps, which depict distances in time. Many geographers state that living space is changing in the world. With improved transportation technology, planners often speak of a shrinking world. However, this observation is not unique to the transportation system. One could find many other areas of communication, whether it be via e-mail, telephone, financial trading, or cultural exchanges, where the concept of spatial distance must be revised.
b Definition
The ratio of the real and the perceived distances, in travel time.
c Computation
In 2013, researchers Ioannis Spilanis, Thanasis Kizos, Michalis Vaitis and Nikoletta Koukourouvli at the University of the Aegean made an Atlas of the European Islands, where they computed the accessibility of selected islands using the formula:
VD= (RΤ + ΒΤ+ WΤ + (P x 168/Ν)) x TS
VD = Virtual Distance (km)
RT = Real Travel Time (h)
BT = Boarding Time (h)
WT = possible waiting time if the trip includes a change of ferries in a port (h)
P = probability of catching the ferry
168 = number of h/week
N = frequency of weekly connections
TS = travel speed of the ferry assumed at 20 knots (29,7 km/h)
The formula above calculates the perceived distance from a mainland port to an island’s port. If your travel includes distances on both the sea and land, it is better to use a simpler way of computing:
Perceived distance = real time [h] x 90 [km/h]
Time = the time the journey takes in hours
90 km/h = the speed of a car on a trunk road
| 1 | 2 | 3 | 4 |
| The perceived position of the island is four or more times the real one | The perceived position of the island is three times the real one | The perceived position of the island is two times the real one | The perceived position of the island is the same as the real one |
d Example

In 2019, the Region of Stockholm used “time geography” to make an isochronic map of its archipelago. They used the simpler formula, multiplying the journey’s time (in hours) by the speed of a car on a trunk road (90 km/h).
In the table below, you can see the real and the perceived distances to fourteen inhabited islands in the Stockholm archipelago. On the map, the islands have been moved from their true positions (bold outlines) to new positions (marked in yellow) at a perceived distance, which is how far you get when travelling on the mainland at 90 km/h.
| Real distance (km) | Real travel time (min) | Perceived distance (km) | Ratio | Value for Indicator | |
| Arholma | 56 | 70 | 105 | 1:1,9 | 3 |
| Tjockö | 30 | 31 | 47 | 1:1,6 | 3 |
| Blidö | 35 | 94 | 141 | 1:4,0 | 1 |
| Yxlan | 30 | 61 | 92 | 1:3,1 | 2 |
| Ljusterö | 25 | 46 | 69 | 1:2,8 | 2 |
| Ingmarsö | 33 | 79 | 119 | 1:3,6 | 1 |
| Svartsö | 33 | 69 | 104 | 1:3,1 | 2 |
| Möja | 45 | 125 | 188 | 1:4,2 | 1 |
| Gällnö | 30 | 64 | 96 | 1:3,2 | 2 |
| Sandhamn | 38 | 81 | 122 | 1:3,2 | 2 |
| Runmarö | 25 | 37 | 56 | 1:2,2 | 3 |
| Nämdö | 36 | 69 | 104 | 1:2,8 | 2 |
| Ornö | 32 | 55 | 83 | 1:2,6 | 2 |
| Utö | 28 | 68 | 102 | 1:3,6 | 1 |
Computation for Arholma
The time the journey takes in hours:
70 min / 60 min/h = 1.17 h
Perceived distance:
1.17 h x 90 km/h = 105 km
Ratio:
105 km / 56 km = 1.88, thus 1:1,9
The Euclidian world where space is flat and defined by straight and parallel lines, a world of stable entities and common-sense assumptions, has governed our understanding for the past two thousand years. It is an engineering model of planning, with a penchant for advanced decision making and blueprinting, claiming superiority to other forms of decision making due to its scientific character.
Entering into a non-Euclidian world of space-time geography can help us understand how people perceive our islands, their accessibility and habitability.
References
- ESPON. 2010. Islands’ Atlas. The Development of the Islands – European Islands and Cohesion Policy (EUROISLANDS). ESPON 2013 Program. ESPON & University of the Aegean. Opens in PDF-format.

The Habitability Handbook – An assessment tool for viable island communities by the Archipelago Institute at Åbo Akademi University is licensed under Creative Commons Attribution-NonCommercial-NoDerivatives 4.0 International License.