The search engine is the heart of our site. All our content is at your fingertips, just start typing and the search will present hits in several categories.
Islands use energy for heating, electricity, and transportation on land and sea. Energy sources can be electricity – sometimes with the help of an electric cable to the mainland, oil-based fuels, and wood-based fuels. Local energy can be wind production, solar production, and heat pumps.
In 2015, a project called Smilegov, financed by Intelligent Energy Europe under the European Commission, investigated energy consumption, energy solutions, greenhouse gas emissions, and the efforts to produce sustainable energy locally on fifteen small islands of Europe. The islands were Ischia (Italy), Molène, Sein and Ouessant (France), Aran, Bere, Oilean Chléire and Arranmore (Ireland), Ven, Vinön and Visingsö (Sweden), Simskäla and Sottunga (Åland Islands) and Nagu and Iniö (Finland).
The project investigated whether:
small islands are energy-efficient,
the energy consumption patterns of islanders and mainlanders are the same, and
whether small islands have a positive or negative carbon balance.
Depending on whether the population of the island is counted as census data or total human pressure (person-days of summer residents and visitors included), the yearly energy consumption of the islanders ranges from 11,328 kWh per capita (Nagu in Finland) to 35,785 kWh per capita (Simskäla). If the total human pressure is not included, people on Nagu use 21,900 kWh, and residents of Simskäla use 66,457 kWh.
Islanders tend to exclude the impact of the sea and sea transport in their energy accounts. If an island is a piece of land surrounded by water, the “wet area” of the island should be included when making a carbon balance sheet and the impact of ferries, which are an integral part of the island society. The project could conclude that the main reason islanders are such extreme energy users is marine traffic: 36.8% of the total energy used on these fifteen small islands is for ferries, an unrequired means of transport in mainland communities.
In May 2017, the European Commission, together with 14 Member States, signed the “Political Declaration on Clean Energy For EU Islands”. This declaration was born out of recognising that islands and island regions face a particular set of energy challenges and opportunities due to their specific geographic and climatic conditions. The opportunities have the potential to make Europe’s island communities innovation leaders in the clean energy transition for Europe and beyond. In 2018, in cooperation with the European Parliament, the EU Commission set up a secretariat to deliver the objectives of the Clean Energy for EU Islands Initiative. Today, the Clean Energy for EU Islands Secretariat is a platform for the clean energy transition of the more than 2,200 inhabited European islands.
Energy can be used more or less efficiently and for more or less important purposes. By monitoring the sectors using energy, you can find measures to improve the island’s energy use. The average consumption of energy in Europe is high in cold countries like Iceland (15,305 kWh) and Finland (11,897 kWh) but low in developing nations such as Albania (2,221 kWh) and warmer countries such as Malta (3,303 kWh), as per figures from 2020, based only on the number of residents. When computing local energy use on an island, one must consider the whole population: all-year residents, part-time residents, summer residents and visitors.
Islanders use a lot of energy since they must travel by ferry from and to their islands. The European project Smilegov, focusing on implementing sustainable energy planning on islands, could conclude that 36.8% of the total energy used on the fifteen small islands sampled in the project was for ferries, an unnecessary means of transport for mainland communities.
For this indicator, you need the data from indicators 1–4 on population, for which you will calculate the energy use of the households. Land transportation calls for a lot of citizen science: you need to count cars, buses, and tractors and how many kilometres they cover on the island. For sea transportation, you better talk to the personnel on the ferry to get it right. The municipality may know the municipal, industrial and agricultural energy spending; otherwise, this calls for more inquiries, surveys and other detective work.
b Definition
Energy use per capita and year: kWh/p, y, population counted on the total human pressure.
c Computation
1
2
3
4
Over 30,000 kWh/p, y
20,000-30,000 kWh/p, y
10,000-20,000 kWh/p, y
Under 5,000 kWh/p, y
d Example
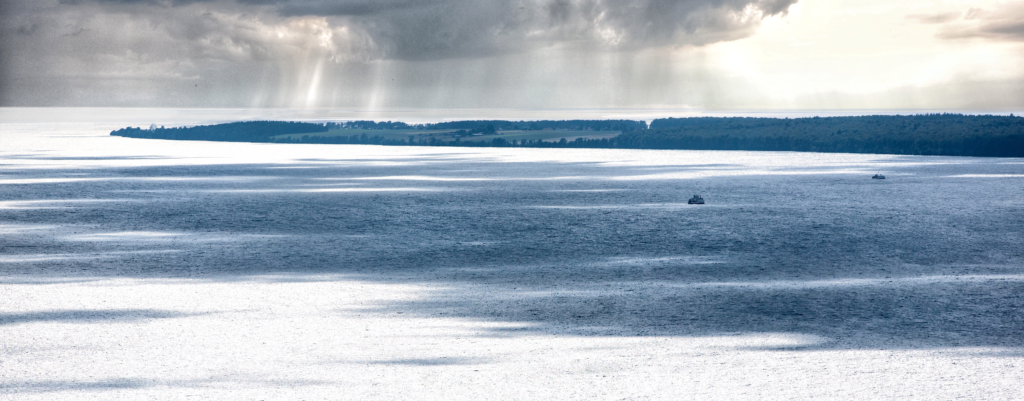
Visingsö. Picture by Christian Pleijel.
Visingsö is Sweden’s 33rd largest island with an area of 25 km2, 14 km long, located in Lake Vättern. Lake Vättern is of great practical, historical and economic importance to the island’s history, economy, and energy use.
Visingsö has 736 registered residents. The chairman of the Visingö Council calls them “two-footers” (standing with both feet on the island). There are also about one hundred people who spend half the year on the island. The chairman calls them “one-footers” (standing with one foot on the island and one ashore). Quite a smart way of describing the two categories of people on the island, besides summer residents and visitors.
Category
No of individuals
No of days spent on the island
Person-days
Two-footers
736
365
268,640
One-footers
100
150
15,000
Summer residents
200
60
12,000
Visitors
100,000
1
100,000
Total
380,640
The average human presence on Visingsö is 380,640 / 365 = 1,043. From ecological, energy, and infrastructure perspectives, Visingsö’s population is not 736 but just over a thousand.
Visingsö belongs to the County of Jönköping and is served by a ferry from Gränna. The length of the ferry route is 6,200 metres, and the crossing time is approximately 25 minutes. The new (2014) ferry, m/s Braheborg, has a capacity of 34 cars and 397 passengers. She is 58 metres long and has a maximum speed of 13 knots. With a gross tonnage of 1,500 tonnes, she is the largest ship that has ever operated on Lake Vättern. The seasonal variations in traffic needs are large. The older m/s Ebba Brahe and m/s Christian Brahe are used during peak summer hours.
The residents, companies, and visitors on Visingsö consume energy for (1) households (heating, hot water), (2) land transportation, (3) sea transportation, (4) municipal technology and other public services (water, sewage, street lighting, roads and other infrastructure), (5) agriculture, forestry and fishing, and (6) industry and construction.
(1) Households
A Swedish household uses an average of 60% of the energy to heat the house, about 20% for hot water (shower, sink, etc.) and the remaining 20% for household electricity: refrigerators, washing machines, lighting, TVs, computers and other electrical appliances. This should also apply to Visingsö’s 360 households, i.e. 8.2 MWh per person and year.
8.2 MWh x 1,043 = 8,553 MWh
(2) Land transportation
Road-bound traffic on Visingsö can be calculated by the number of vehicles transported by ferry (78,050 round trips in 2015, as well as 2,396 dump trucks and 137 buses). If each vehicle drives from the ferry terminal to Kumlaby and back, it gives 644,644 kilometres, not counting the islanders’ local runs.
644,644 km x 0,07 l/km = 45,125 litres
Since this value is for vehicles running on both gasoline and diesel, we will use a calorific value of 9.5 kWh:
45,125 l x 9.5 kWh / 1000 = 429 MWh
(3) Sea transportation
Many islands prefer not to include maritime traffic as part of the island’s energy use. It might also be difficult to obtain energy data (fuel and emissions) from ferry operators. The arguments for including the energy that the ferries consume between the island and the mainland are two: the ferry traffic exists because there is an island, and the energy is consumed in the island’s waters, which means that the discharges are local.
The fuel consumption for a ro/pax ferry of Braheborg’s size is between 200 and 500 litres per hour. Consumption is not static but is affected by ship-specific parameters (hull shape, weight, machines) and external factors (currents and ice conditions). The low calculated consumption for m/s Braheborgs, based on the fact that she has a GRT of 1,500 tons, four Volvo Penta diesels with a total power of 1,920 kW and makes 13 knots, is about 200 litres of marine diesel per hour. For m/s Christina Brahe and m/s Ebba Brahe, 100 litres/hour is assumed.
In winter, m/s Braheborg makes 32 trips per day of 25 minutes; in summer, 34 trips. The two smaller ships make 14 trips per day during summer, totalling 6,113 running hours per year.
The estimated annual consumption is 1 million litres. One litre of marine diesel is equivalent to 10,96 kWh. The ferries thus consume 10,960 MWh per year.
1,000,000 l x 10.96 kWh / 1000 = 10,960 MWh
(4) Municipal technology
Reported as 3,754 MWh.
(5) Agriculture, forestry and fishing
According to the municipality, 3% of the total energy consumption is for agriculture, forestry, and fishing = 751 MWh.
(6) Industry and construction
Most industry on Visingsö is construction work. It has been estimated by the municipality to be a total of 1,472 MWh.
Population
1,043 persons
Households
8,553 MWh
Land transportation
429 MWh
Sea transportation
10,960 MWh
Municipal services
3,754 MWh
Agriculture, forestry and fishing
751 MWh
Industry and construction
1,472 MWh
Sum
25,919 MWh
Per person (1,084)
23,911 kWh
The average total energy consumption per year and per capita in Europe is 28,439 kWh. In Jönköping County, the average value is 34,000 kWh. Visingsö residents are thus well below their neighbours on the mainland, despite their energy-consuming ferries.
The value of Visingsö is 2.
Energy sources consumed on the islands are: gasoline, gasoil, diesel, residual heat oil, anthracite, lignite, natural gas, peat, municipal waste, wood, plant oil, biodiesel, bioethanol, electricity from the grid, solar, and geothermal energy.
For indicator 19, we compiled the island’s energy consumption from the user’s perspective: households, transport etc. Now, we look at it from the other side: which are the energy sources? Gasoil and diesel are consumed by ferries and for land transportation in trucks and tractors. Gasoline is consumed by boats and vehicles on land, such as quad bikes, passenger cars, motorcycles, and mopeds. Lignite (coal), peat, pellets, firewood, and residual heating oil are used for heating buildings. Electricity is used for many purposes: to heat, serve and light buildings, for electric cars, in industry, for street lighting, for telecom and IT services, and others.
The table you create for this indicator will also be of use when working on indicator 23.
b Definition
Comparative use of different energy sources on the island.
c Computation
This is a complicated task asking for consideration and precision. There is much help to get, for example, from the EU initiative Clean Energy for EU Islands Self-Assessment Tool and the webpage of SEAI, Ireland’s national sustainable energy authority.
When calculating the total energy consumption for an island, all different forms of energy are converted into the unit MWh. This is done by utilising the calorific values of the various fuels as is in the table below and dividing the end result by a thousand because the calorific values in the table are stated in kWh. The calorific value indicates how much energy (heat) is generated at full combustion of a certain amount (mass or other physical entity) of different fuels.
The actual calorific value of biofuels, peat and coal depends on their moisture content. If the moisture content of the fuel is known, the calorific value can be increased or decreased vis-a-vis its moisture content.
There are free Energy Consumption Calculators on the internet; one can be found on the webpage of The Archipelago Institute of Åbo Akademi University.
Source
Type
Calorific value
Amount
Sum
Gasoline, cars
1 litre
8.7 kWh
Gasoline, small boats
1 litre
11.9 kWh
Diesel for cars
1 litre
9.9 kWh
Gasoil, diesel for farming
1 litre
11.8 kWh
Marine diesel for ferries
1 litre
11.63 kWh
Residual Fuel Oil
1 litre
10.02 kWh
Kerosene
1 litre
9.5 kWh
Anthracite
1 kg
8 kWh
Lignite briquette
1 kg
7.25 kWh
Coke
1 tonne
6,800 kWh
Peat (50% damp)
1 m3
2.57 kWh
Natural gas
1 m3
10,800 kWh
Municipal waste
1 tonne
2,700 kWh
Wood
1 m3
birch
1,300 kWh
1,700 kWh
Plant oil
1 m3
9,340 kWh
Biodiesel
1 m3
9,340 kWh
Electricity grid
1 kWh
Solar energy
1 kWh
Geothermal energy
1 kWh
Sum
1 kWh
d Example
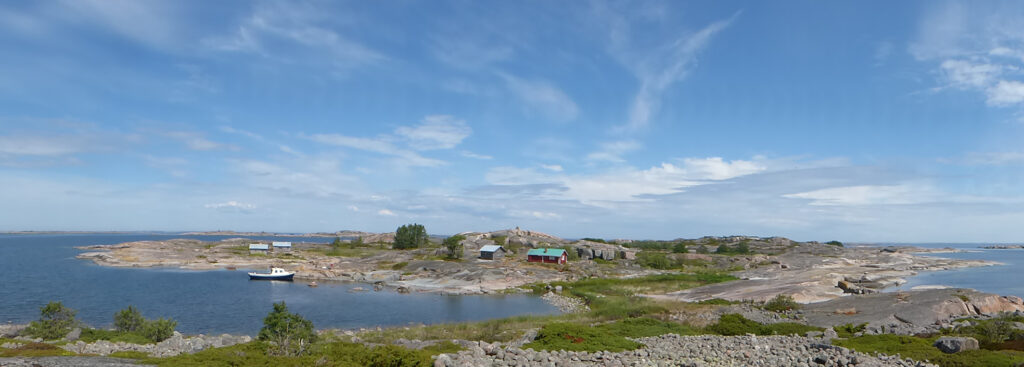
View of a part of Eastern Simskäla. Picture by Christian Pleijel.
Simskäla is an archipelago in Vårdö municipality on Åland, consisting of two main islands, a large number of smaller islets, cobs and skerries and a village; all in all, comprising about 2,000 hectares of land, of which the main islands make up just over half, and about 12,000 hectares of water area. There are 35 residents on the island. Three of these are farmers who grow vegetables in greenhouses. There are also 50 summer residents who spend 100 days on Simskäla and 200 summer residents who spend 30 days. This sums up to 23,775 person-days, divided by 365 = an average population of 65 persons.
The residents and visitors of Simskäla consume energy mainly for (a) heating, (b) transport, and (c) municipal services (water and sewage). The 13 households are heated with oil & air heat pump (1 household), ground / geothermal heat (3 households), wood chips (2 households) and wood combined with an air heat pump (7 households). The summer cottages are heated with wood and electricity, and there are 5-6 small, private wind turbines.
The main industry on Simskäla is greenhouse cultivation, for example, radish, of which 20 tonnes are exported to Finland every year. The greenhouses are heated with 25 loops of hose in the bay next to the greenhouses, each 800 metres long, and these 20 kilometres of hose are filled with a water-alcohol mixture. They function according to the same principle as geothermal heating: cold water in the hose is heated by the sea and returned back to the heat exchange system. Between 80 and 90 per cent of the heat required for the greenhouse crops is thus provided by the sea, even in winter when the sea is frozen. More than 100 tonnes of diesel have been replaced by renewable energy. To produce 1,000 MWh, the pumps running the system consume 250 MWh.
The ferry weighs 60 tonnes, runs 3,200 h/y and uses 23 litres an hour, summing to 70 tonnes = 114 MWh.
The energy sources of Simskäla are:
Source
Type
kWh
Amount
Sum
Gasoline, cars
Diesel, cars
1 litre
1 litre
8.7 kWh
9.9 kWh
6,000
9,000
52.2 MWh
89.1 MWh
Gasoline, small boats
Diesel, small boats
1 litre
1 litre
11.9 kWh
9.9 kWh
5,000
6,000
59.5 MWh
59.4 MWh
Gasoil, diesel for farming
1 litre
11.8 kWh
4 m3
47.2 MWh
Marine diesel for ferries
1 litre
11.63 kWh
70 tonnes
977 MWh
Wood
1 m3
birch
1,300 kWh
1,700 kWh
180 m3
234 MWh
Electricity grid
Greenhouses
Inn
1 kWh
1 kWh
250 MWh
20 MWh
Sea thermal energy
1 kWh
1 kWh
750 MWh
Geothermal energy
1 kWh
1 kWh
40 MWh
Solar energy
1 kWh
1 kWh
6 MWh
Sum
2.584,4 MWh
Computations:
Diesel for the ferry, using the calorific value of 11,63 kWh/l
1 ton of diesel has a volume of approximately 1.200 litres.The ferry: 70 tonnes x 850 = 59,500 l
59,500 l x 11,63 kWh/l / 1000 = 977 MWh
Gasoline for cars, using the calorific value of 8,7 kWh/l
6,000 l x 8,7 kWh/l / 1000 = 52.2 MWh
Gasoil, using the calorific value of 11,8 kWh/l
4 m3 = 4000 l4000 l x 11,8 kWh/l / 1000 = 47.2 MWh
Wood, using the calorific value of 1,300 kWh/m³
180 m3 x 1,300 kWh/m3 / 1000 = 234 MWh
The high energy consumption per capita on Simskäla is due to the ferry and electricity for the pumps of the greenhouse heating system. For its very innovative solution for heating the greenhouses, Simskäla was nominated for the EU Sustainable Energy Award in 2017.
Since the middle of the 19th century, human carbon dioxide emissions have increased carbon dioxide levels in the atmosphere from 270 ppm (parts per million) to over 400 ppm. In parallel, the earth’s average temperature has increased by almost one degree. The most important gases that contribute to the greenhouse effect are carbon dioxide (CO2), nitrogen oxide (NO), methane (CH4), freons, water vapour, and ozone. Carbon dioxide is the most abundant greenhouse gas in terms of volume. Atmospheric carbon dioxide measured at NOAA’s Mauna Loa Atmospheric Baseline Observatory peaked in May 2021 at a monthly average of 419 ppm, the highest level since accurate measurements began 63 years ago.
Carbon sources
The emissions of gases like nitrogen, methane, freons, water vapour, and ozone are usually collected as greenhouse gases. The carbon-containing compounds are often referred to as carbon dioxide emissions. The source of these compounds is human use of fossil coal, oil and natural gas, and they are the basis for the ongoing change of the earth’s climate, especially near the ground where the greenhouse gases heat the air. Changes in land use, deforestation and the production of cement (an ingredient in concrete) and fertilisers (phosphorus and nitrogen) also strongly affect the atmospheric content of carbon dioxide and cause the earth’s temperature to rise.
For practical reasons, all greenhouse gases are usually converted to carbon dioxide equivalents of CO2e, a measure of greenhouse gas emissions that takes into account that different greenhouse gases have different abilities to contribute to the greenhouse effect.
Island communities often use more energy than mainland communities. Islanders make a large ecological footprint because they have to take a ferry from and to their island, which increases their energy use by an average of 37% (indicator 19). On the other hand, they live in a large carbon sink: the sea.
The vast majority of people are worried about climate change. An island that wants to be resilient must keep track of its emissions and help to reduce them. Most household emissions come from heating houses, heating domestic water, land, sea and air traffic, agriculture/land use, and electricity consumption. The emissions are directly related to the island’s energy consumption. Thus, one can switch to more climate-friendly heat sources (solar, wind, geothermal and firewood) and avoid unnecessary travel and transport.
Carbon sinks
A carbon sink captures carbon dioxide from the atmosphere by binding it. An easy way to describe it is that a sink absorbs more carbon dioxide than it emits.
Carbon sinks capture carbon dioxide for a long time, which means periods of a few decades up to several thousand years. The longer, the better. The largest carbon sinks are the oceans, the forests and the soil. The plants, the ocean planktons, fungi and bacteria absorb carbon when they grow. The forest’s carbon sink varies depending on tree species, ditches, felling, soil type, etc. An approximate value for European forests’ carbon sink is 1.7 tons CO2e per hectare of forest. In a recent Swedish study, measuring the forest in forest cubic metres (m3) – here 140 m3 per hectare, Swedish forests accumulate more than 50 tons of CO2e annually.
For an island, carbon sources and carbon sinks are difficult to calculate, both globally and locally.
Computation
Carbon sources
Use the table and numbers from indicator 20:
Source
MWh
LCA emissions, kg per MWh
Sum
Gasoline, cars
299
Gasoline, small boats
299
Gas oil, diesel for farming
305
Diesel fuel for ferries
321
Residual Fuel Oil
310
Anthracite
393
Lignite
375
Natural gas
237
Municipal waste
339
Wood
2–405 a)
Plant oil
182
Biodiesel
156
Bioethanol
206
Electricity grid
295
Solar energy
b)
Geothermal
b)
Sum
Sum per capita counted on the number of persons in the population
Please note that the table is based on Life Cycle Analysis (LCA) emission factors, including the identification of energy and inputs of material, meaning, for example, that wind power figures include raw material and the building of a wind turbine. The numbers are taken from the Technical annexe of The Covenant of Mayors.
a) Lower if the wood is harvested in a sustainable manner, higher if harvesting is unsustainable
b) Data not available, but emissions are assumed to be low
Carbon sinks
One can calculate the carbon sink of oceans and for large volumes of sea, such as the Irish Sea, the Tyrrhenian Sea or the Baltic Sea. However, the local carbon sink in the island’s water area, as we calculated under indicator 9, is impossible to calculate.
Hectare
Coal sink per ha
Sum
Forest
50 tonnes CO2e
Carbon dioxide emissions minus carbon sink per capita, annually.
1
2
3
4
More than 12
11.9–9
8.9–6
Under 5.9
Example
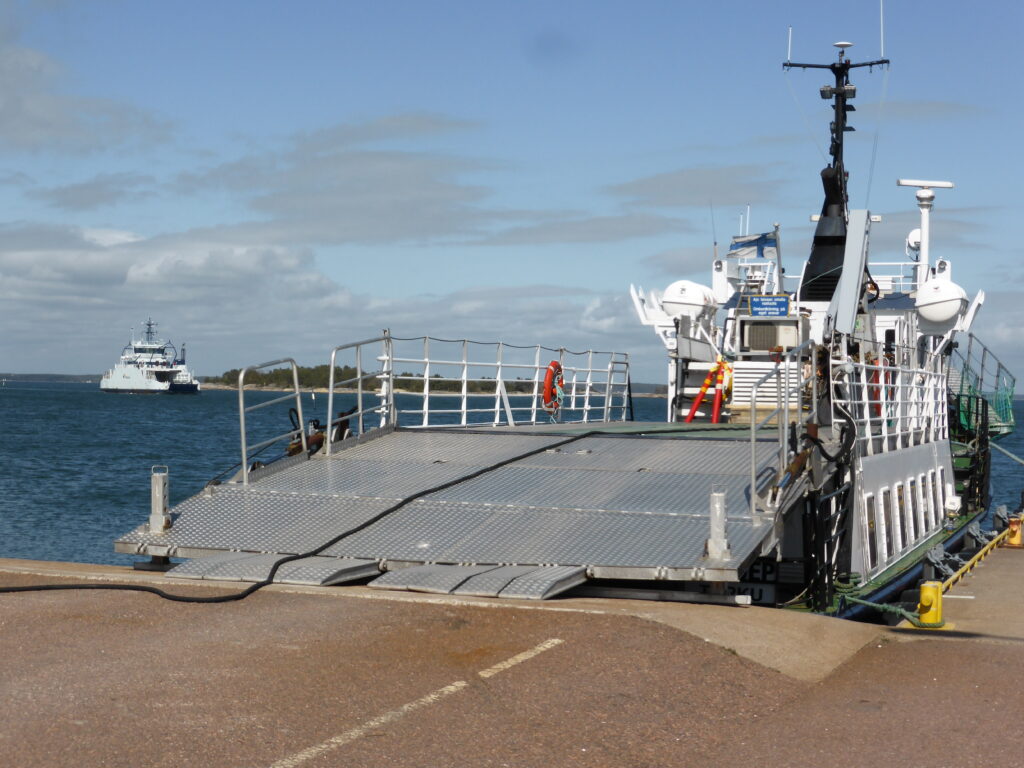
Commuter ferry on Iniö. Picture by Christian Pleijel.
Iniö is an archipelago outside Åbo in Finland with 200 inhabitants. It was a municipality of its own until 2009, when it was integrated into the city of Pargas. Iniö is an archipelago, a group of islands with about a thousand islands, islets, skerries and cobs. The land area is 64 km2, and the water area is 273 km2, totalling to 337 km2. 83% of Iniö’s surface is water, and 1,000 hectares of Iniö are covered by forest.
There are 200 all-year residents on Iniö and 400–500 summer cottages with a summer-time population of about 1,000 persons, all in all (73,000 + 60,000 =) 133,000 person-days, equivalent to 364 people.
Iniö is served by three ferries that interconnect the larger islands. Ferry traffic’s share of the energy consumption – and thus carbon dioxide emissions – is large on Iniö, over 50%, according to the computation. Connecting boats, leisure boats, and passenger traffic also have significant shares. The total emissions from maritime traffic are 1,000 tonnes of CO2e.
Energy consumption and emissions:
Source
MWh
LCA emissions, kg per MWh
Sum
Gasoline, cars
230
299
68 tonnes
Gasoline, small boats
955
299
285 tonnes
Gas oil, diesel for farming
478
305
146 tonnes
Diesel fuel for ferries
2,230
321
715 tonnes
Residual Fuel Oil
437
310
135 tonnes
Wood
1,755
2–405 a)
8 tonnes
Electricity grid
273
295
81 tonnes
Sum
6,358
1,438 tonnes
Sum per capita counted on the number of persons in the population (364 persons)
17.5
3,951 kg
Carbon sink:
Hectare
Coal sink per ha
Sum
Forest
1,000
50 tonnes CO2e
50,000 tonnes
When the islanders of Iniö’s made a local energy plan in 2015, the 1,000 hectares of forest was estimated to be a carbon sink of 1,700 tonnes. New research from 2020 tells us it should be 50 tonnes per hectare, thus 50,000 tonnes. The volume of the sea surrounding Iniö is 15 km3 but cannot be counted.
Each person on Iniö, counted as 364 persons, uses 17.5 MWh individually per year, which is close to the average value for Finland. Their individual emissions of CO2e are 3.95 tons.
When it comes to energy use and emissions, Iniö is a very habitable island. Adding the carbon sink from the island’s forest, Iniö leaves no ecological footprint at all. The value for Iniö is thus 4.
N.B. The CO2 emissions from farming and farmland would also be a very important factor to estimate. There is some data available; ca 5 CO2e/hectare. Very varying depending on soil type and use.
Islands face an important challenge regarding energy supply due to their small size and isolated energy systems. If they are not connected to the mainland by cables, they are typically dependent on fossil fuel imports for electricity generation, transport, and heating.
Local energy benefits the local economies of islands. Locally produced energy will probably lower CO2-emissions, deliver financial and psychological benefits to the community and its stakeholders, and create local jobs.
b Definition
Percentage of total energy consumption produced locally on the island.
c Computation
With the help of the past indicators, make a simplified energy balance sheet of your island:
ENERGY DEMAND
ENERGY SUPPLY
MWh
Percentage
MWh
Percentage
Land transport
Imports
Private houses
Fuel
Holiday houses
Electricity
Industry
Gas
Municipal services
Locally produced energy
Sea transport
Wood
Wind
Solar
Geotermal
1
2
3
4
24% or less
25-49%
50-74%
75% or more
d Example
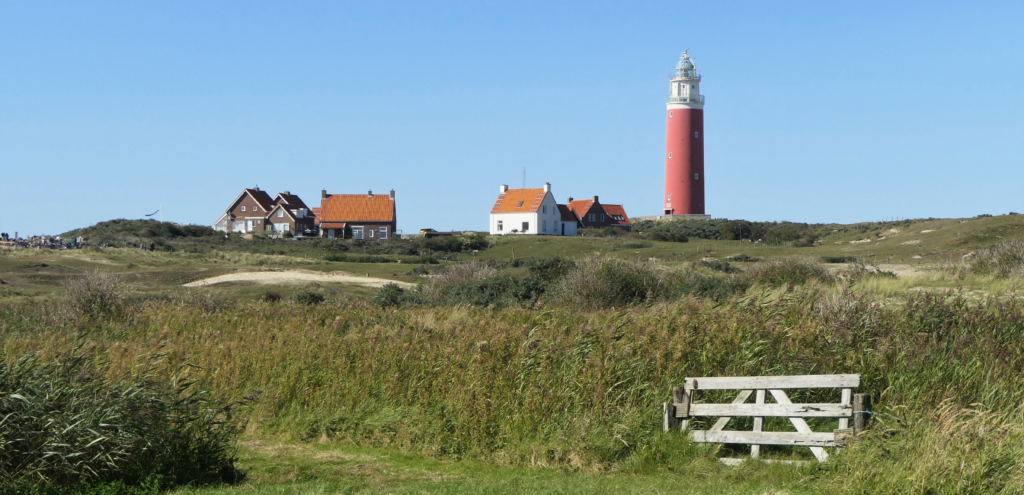
The lighthouse on Texel. Picture by Christian Pleijel.
Texel was first formed in a storm on Allerheilegenflut (All Saint’s Day) in 1170. Still, it didn’t become an island until a hundred years later, when another storm separated it from the mainland. Today, it is the largest Dutch Frisian island with seven villages, part of the Unesco World Heritage Wadden Sea. Texel’s dry area is 162 km2, and the wet area is twice as large: 301 km2. The island is home to 13,584 inhabitants who live in 6.050 private houses. There are 3.230 holiday houses, 1.240 companies, 5.677 personal cars, 1.743 vans and lorries, and 666 motorcycles on Texel.
Many of the islanders rely financially on tourism-related activities, making the local economy highly dependent on summertime visitors. Tourism is regarded as both blight and blessing – it brings in more than the agriculture and fishing industry. The ferries bring approximately 2 million visitors and a million car passengers to and from Texel per year.
Texel can’t quite cope with its tourism. The unique sheep and lamb found here aren’t those visitors find on their plates since most meat is imported from New Zealand. Pollution threatens Texel – the island’s skies are not so starry anymore. 80 percent of the visitors have visited the island before. Many of these are ornithologists, worrying that the birds are being affected by night light from villages, cars and ships.
In 2007, people from Texel and the neighbouring islands of Terschelling, Schiermonnikoog, Ameland, and Vlieland gathered for a conference about the islands’ futures. The conference produced four different scenarios, which were then discussed among all the Texel islanders, resulting in a fifth scenario called Texel Unique Island. This included a ceiling for tourism of 47,000 guest beds.
There are three strategic areas:
(1) Texel provides energy, meaning that the island will produce more renewable energy than it uses.
(2) Texel is a human recharging station, meaning that the island will give renewed energy and strength to its visitors.
(3) “Tested and Tried” on Texel, meaning that the island will be an experimental area where various types of trials and tests can be carried out. The phrase ‘light pollution’ was coined here.
Sustainable energy sources are readily available: sun, wind, waves, and tides. In 2014, then alderman of Texel Eric Hercules called for the island to be one of the first municipalities in the Netherlands to be energy neutral by 2020.
Six years later, current alderman Hennie Huisman-Peelen had to admit that the ambition to be self-sufficient by 2020 was far from being achieved. Much had been researched, tried, and developed, yet only 5% of all energy had been generated sustainably on the island. “The landscape is the capital of our island, and we have to be careful with it. Wind turbines and solar parks affect its appearance. That is why part of the population is strongly against it. Others want to realise their sustainable ambitions and take steps. Because of this division, it is difficult or impossible to get energy projects off the ground.”
In 2020, the simplified energy balance of Texel looked like this:
Renewable energy is energy generated from natural sources that are continually replenished, such as sunlight, wind or waves. Renewable energy usage in energy production usually causes significantly less inconvenience than other energy sources and should always be promoted.
The use of renewable energy is one of the most powerful ways of reducing our ecological footprint. It measures how fast we consume resources and generate waste compared to how fast nature can absorb our waste and generate resources.
Researchers use the term “ecological footprint” to describe how many resources come from using fossil fuels. It is done by estimating how large an area of newly planted forest (as mentioned in indicator 20) is needed to “catch” carbon dioxide in the atmosphere from our use of oil, carbon and gas. Our example island below is situated in Germany, which in 2020 had an ecological footprint of 5.3, meaning we would need five planets instead of the one we have.
b Definition
Proportion of the island energy produced from renewable sources.
c Computation
Use the table you made for indicator 20, adding new columns:
Source
Sum in MWh
Non-renewable
Renewable
Percentage of total energy use
Gasoline, cars
Gasoline, small boats
Diesel for cars
Gasoil, diesel for farming
Marine diesel for ferries
Residual Fuel Oil
Kerosene
Anthracite
Lignite briquette
Coke
Peat (50% damp)
Natural gas
Municipal waste
Wood
Plant oil
Biodiesel
Bioethanol
Electricity grid
Solar energy
Geothermal
Sum
1
2
3
4
24% or less
25-49%
50-74%
75% or more
d Example
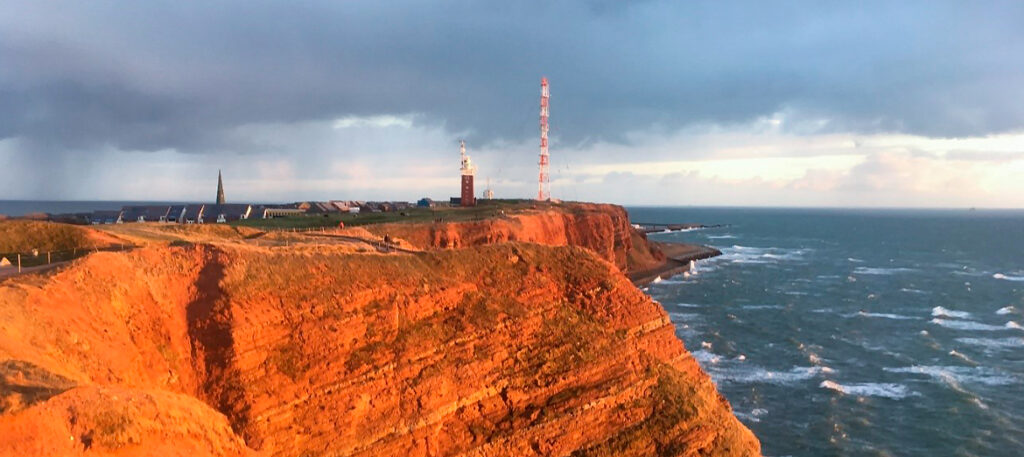
Helgoland. Picture: Christian Plejel.
The islands of Helgoland are the only two German islands that are not in the immediate vicinity of the mainland. They are situated in the North Sea, 69 kilometres north of the mainland at the mouth of the River Elbe. They are very small, only covering 1.0 + 0.7 km2 of land, with a permanent population of 1,469 inhabitants. Helgoland is a holiday resort, with over 50 million tourists visiting since 1826. It enjoys tax-exempt status, as it is part of the EU but excluded from the EU VAT area and customs union. It has, though, ceased to be the tourist magnet it once was: with 800,000 tourists a year in the seventies, the number of visitors has since long been halved. In 2021, the number was 319,000. Besides tourism, marine research and harbour services are the main sources of income.
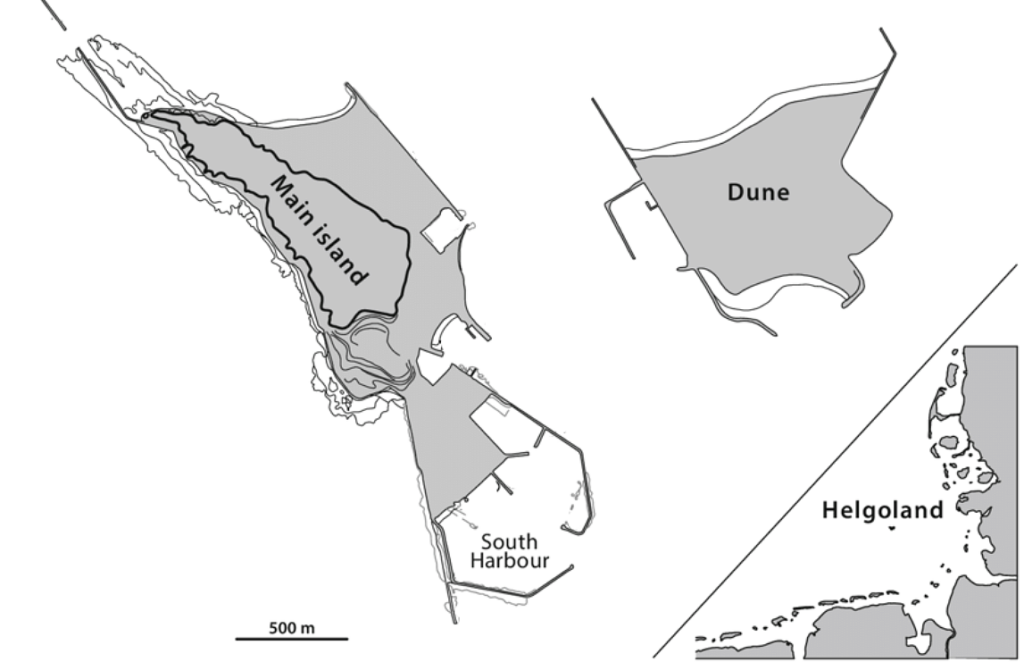
Schubert, Philipp R.: Map of Helgoland and its location in the German Bight, North Sea (bottom right corner), modified from Beermann. 2020.Map source: ResearchGate.
In 1990, a 1.2 MW wind turbine was installed. Besides technical problems, the turbine was not lightning-proof, and insurance companies would not provide coverage. The islanders viewed the wind energy project as a failure and stopped it.
In 1997, a group of students under the direction of professor Beate Ratter at Hamburg University estimated Helgoland’s ecological footprint. They multiplied the then 1,370 residents by 365 days, added the 288,102 day-visitors at 0.5 days each, and the 206,477 overnight visitors at one day each. The total was 848,578 days. They computed all the food, electricity and water consumed by people during 848,578 days and added the ships’ fuel for 494,579 trips, which made up for 85% of the entire imposition. They assumed that Helgoland’s area is 1 km2 and arrived at 10,502.5 gha (global hectares), meaning Helgoland then managed to consume 62 times its own surface.
In 2009, Helgoland was connected to the mainland with a 53 km submarine power cable. Until then, electricity on Helgoland was generated by a local diesel plant, still in use for heat supply and still 100% heavy fuel oil-based. Drinking water on Helgoland (150,000 m3) is made from seawater, consuming 11% of the island’s power supply. Sewage is treated in a municipal wastewater treatment plant, and waste is shipped to the mainland weekly. Mobility is 95% electrified. Lighting on the island is already 99% LED-based.
In 2011, the municipality set the goal to become a Zero Emission Island by 2020. A major step forward was a 100% LNG powered island ferry, m/s Helgoland, in 2015. It generates 30% less carbon dioxide than fuel oil and 45% less than coal, with a twofold reduction in nitrogen oxide (N0x) emissions and almost no sulphur dioxide (SO2) emissions. Since 2016, a project has been aimed to replace the diesel plant. The goal will be a 50% reduction of the island’s CO2 emissions.
With its main business, tourism, in dangerous decline, the island needs a new business model. Helgoland has become a service island for the offshore wind industry. Companies that maintain and control wind farms in the North Sea have established themselves on Helgoland and, since 2015, brought the island ten million euros in business tax annually. Mayor Jörg Singer has used the offshore money to renovate ports and build apartments. In three years, the island should be free of debt.
Helgoland is currently changing from a holiday island to an energy island and becoming the centre of one of the largest hydrogen projects currently planned in the world. Hundreds of new wind turbines are to generate electricity in the sea off the island, and the electricity will generate hydrogen on-site, which in turn is brought to Helgoland by pipeline. From there, it goes on to the mainland by ship.
Some people on Helgoland are afraid that the hydrogen project is a few sizes too big for the island. The chemicals needed to make hydrogen transportable are dangerous, and they are afraid the tourists will be scared off. “They want to come to a natural island and not an industrial island”, says a local politician.
Most people on Helgoland seem to favour offshore wind power and believe hydrogen is a good idea in principle. Global warming is probably the greatest danger to people and animals, as well as to Helgoland. The same rifts run through Helgoland as through the rest of the world of islands: How should one decide between animal welfare and climate protection, nostalgia and progress, and wind energy and homeland security?
Source
Sum in MWh
Non-renewable
MWh
Renewable
MWh
Percentage of total energy use
Annual generation of thermal power with 3 million litres of heavy fuel oil for heating buildings


 The Habitability Handbook – An assessment tool for viable island communities by the Archipelago Institute at Åbo Akademi University is licensed under Creative Commons Attribution-NonCommercial-NoDerivatives 4.0 International License.