


Area 3: Freshwater


Freshwater is essential for all life on Earth. We use it for drinking, washing, flushing our toilets, and irrigating our fields and gardens. We also heat, cool, and contaminate it before letting it back into the ecosystem.
The definition of freshwater is water containing less than 1,000 milligrams per litre of dissolved solids, most often salt. Freshwater is found in lakes, reservoirs, ponds, streams, canals, and freshwater wetlands. Freshwater is part of the water cycle and thus a renewable resource. The degree of precipitation, runoff, and evaporation steer the circulation. The changing climate intensifies hydrologic conditions and, with increasing air temperatures, more water evaporates into the air.
Freshwater amounts to 3% of all water on Earth, 69% of which is bound in glaciers and ice and 30% is groundwater. Only 0.29% of freshwater is found in lakes and swamps, 20% of which is in Lake Baikal in Asia alone. Rivers hold only about 0.006% of freshwater reserves. This means that life on Earth is dependent on a very small fraction of the total water supply on this planet.
Water supply and quality are critical in determining whether a place is more or less habitable. People have built different types of reservoirs to live in places with scarce water supplies. Most islands have freshwater scarcity, making it vital to keep a keen eye on water resources, water quality, how, when, how much, what we use it for, and what we make of it in the end.
References
- US Geological Survey, 2021. Freshwater (Lakes and Rivers) and the Water Cycle. 2021/12/03.
Indicators in the Freshwater area:
Indicator 14: Rain and Snow
a Rationale
Rain fills groundwater reserves from autumn to spring. Vegetation consumes most summer rains. The probability of snow cover varies with season, location, and geographical conditions. Latitudes above 35°N are usually given as a rough boundary for snowfall.
b Definition
Precipitation in mm/year, based on meteorological data on local rainfall obtained from the nearest meteorological station.
c Computation
| 1 | 2 | 3 | 4 |
| Under 499 mm/y | 500-749 mm/y | 750-999 mm/y | Over 1,000 mm/y |
d Example
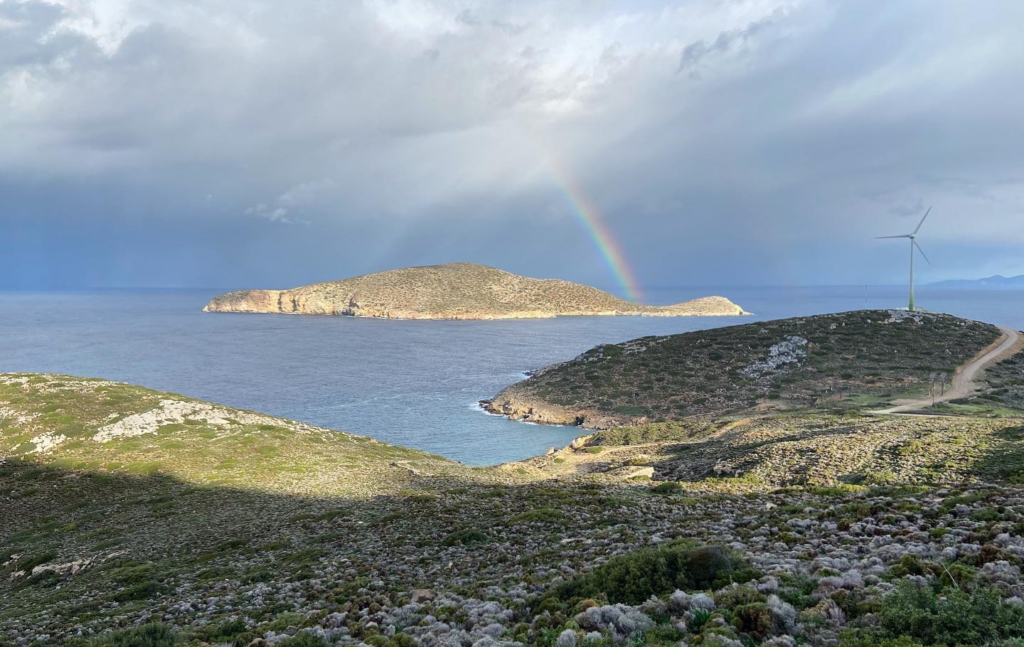
Tilos is one of the Dodecanese islands in the South Aegean Sea, located 22 nautical miles NW of Rhodes and 222 miles from Piraeus. The island’s area is 61.5 km2.
Tilos has a Mediterranean climate with mild, wet winters and dry summers. There is no meteorological station in Tilos. Data from the nearest existing meteorological stations, Kos, reports a total annual rainfall of 703 mm. The distribution of the total annual rainfall among the four seasons is shown in the following table:
| Season | Rainfall (mm) | Per cent/y |
| Autumn | 165 | 23.5 |
| Winter | 413 | 58.7 |
| Spring | 122 | 17.4 |
| Summer | 3 | 0.4 |
| Total | 703 | 100 |
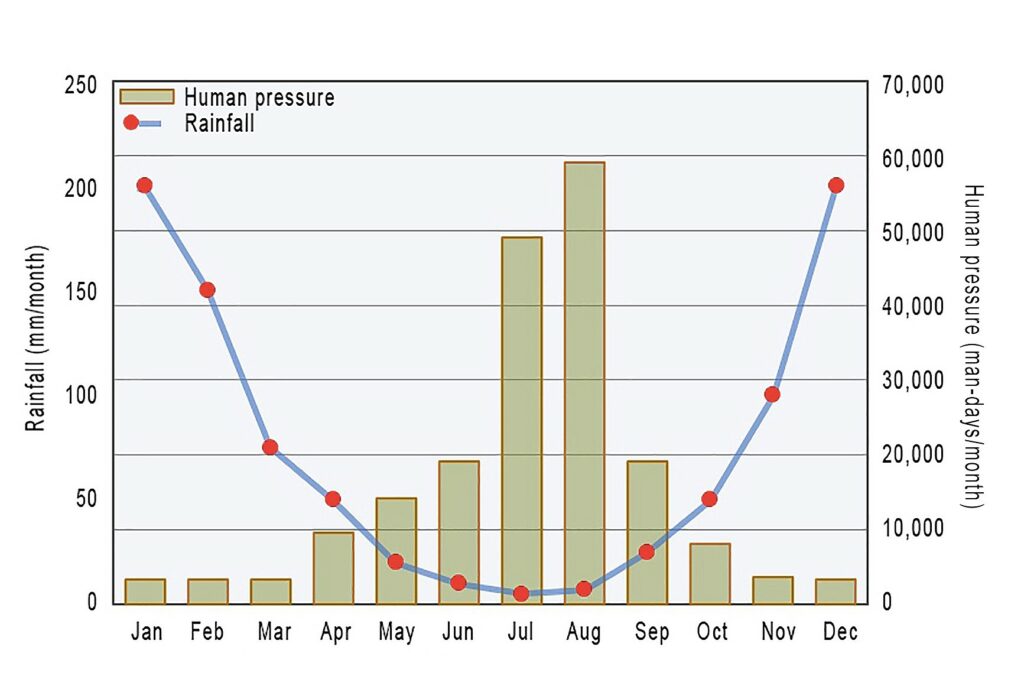
On islands like Tilos, groundwater reservoirs are being emptied in or before summer when the human pressure and need for water peaks, as shown in the diagram below.
According to our indicator, Tilos is on level 2.
References
- Plejel, C (2018). Water Saving Challenge, page 26–28 and 30–32.
Indicator 15: Water resources
a Rationale
The general problem with water resources on smaller islands is the absence of larger lakes, rivers or streams that can be used for water supply. Natural groundwater is the most common freshwater resource, combined with seawater desalination and occasional rainwater harvesting (storage tanks or artificial infiltration).
Groundwater is stored in natural aquifers, geological formations that have sufficient porosity. The aquifer under an island can be described as a groundwater lens recharged by precipitation. The amount of water a lens contains is determined by the size of the island, the amount of rainfall, the permeability of the ground, and water withdrawal rates. There can be salt mixing due to storm or tide induced pressure. Groundwater lenses can be as shallow as 1-2 decimetres or as deep as 20 metres.
The recharge of groundwater is the amount of water that enters the aquifers. Without recharge, extraction leads to the depletion of an aquifer. The extraction must be much smaller than the recharge since the ecological water demand from plants, groundwater-dependent ecosystems, and surface water discharge must also be considered.
The recharge water amount is much less than the precipitation: a large part of the precipitation is lost back into the atmosphere through the evaporation and transpiration of plants. Some precipitation falling on the ground cannot infiltrate the soil, for example, if the soil is already saturated with water or if the surface is impermeable (bedrock and sealed surfaces). This surface runoff will eventually flow into the sea.
The extraction of groundwater from aquifers is affected by the permeability of the soil. Larger amounts of water per unit of time can be extracted from gravel and sand; smaller amounts from clay and silt. In some cases, high extraction rates are possible from bedrock, but more often not. Often very deep wells have to be drilled, which, on an island, includes the risk of finding saltwater.
It is wise to combine scientific research on water resources with local knowledge. On small islands, citizen science is always valuable.
b Definition
The water resources of the island.
c Computation
| 1 | 2 | 3 | 4 |
| Long term scarcity and defects (more than ten days a year) | Short term scarcity and defects (less than ten days a year) | Enough water of good quality | More than enough water of good quality |
d Example
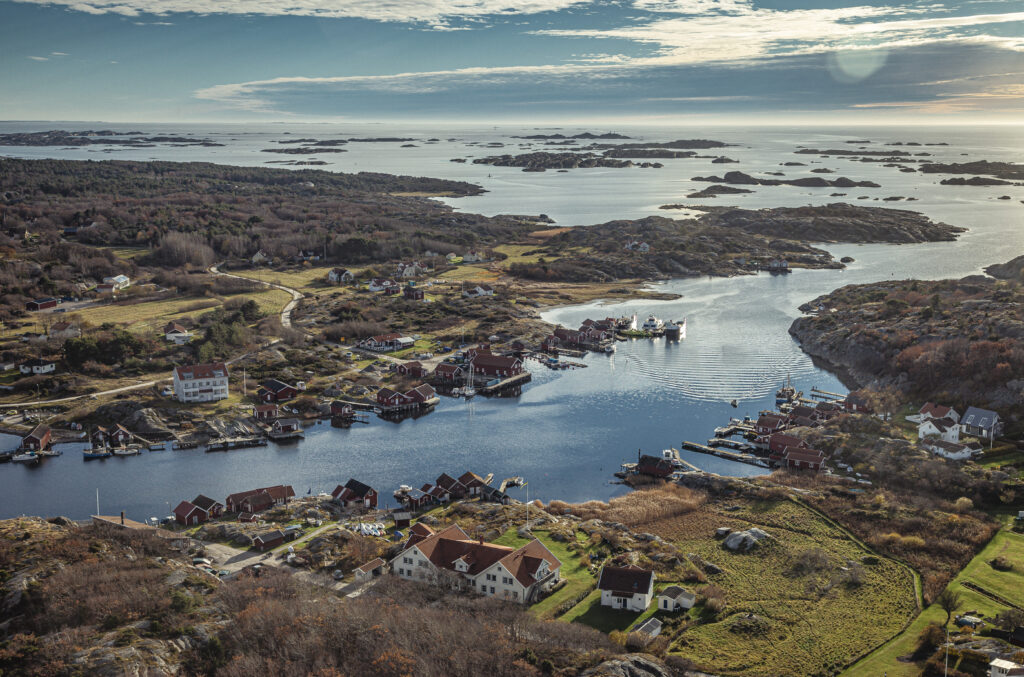
The Koster Islands are two islands close to each other: North Koster and South Koster. They belong to the municipality of Strömstad and are part of the larger archipelago of Bohuslän, situated along the west coast of Sweden. The islands are separated from the mainland by a narrow, 250-metre deep fjord.
The year-round population is 246 persons, and 2,485 live here in the summer. Day-trip visitors are estimated at 107,000 every year, and 50,000 people stay for several days. On a winter’s day, there are 246 water users; on a summer’s day – 6,000.
There are 1,000 wells on Koster. Three hundred are drilled in the bedrock, and 700 are dug in the soil. In 2016, a research team led by professor Roland Barthel from the University of Gothenburg investigated the groundwater reservoir for recharge, extraction and water availability to understand the current groundwater management and the future potential for sustainable drinking water supply. The researchers concluded that there is possibly 3.8 million m3 of groundwater hidden in the two islands, 3,000 m3 in soil and 700 m3 in bedrock.
Knowing the amount of groundwater on the island is important, but it is not the same as availability. On Koster, it occurs mostly in areas far away from the existing wells. Groundwater can theoretically flow over large horizontal distances, but only if large, continuous aquifers exist, which is not the case on Koster. There, the groundwater system is separated into very small disconnected units.
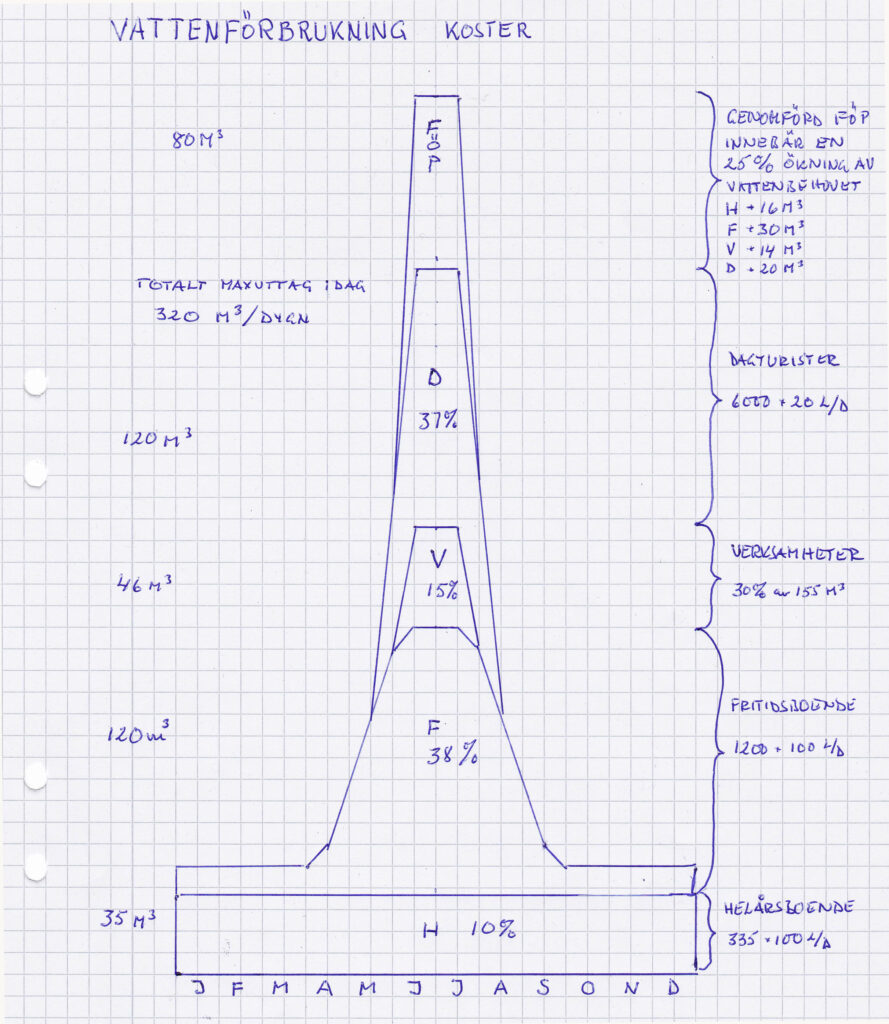
Water resources on islands are subject to quite an uneven demand, as illustrated by Göran Lyth, a Koster resident, in an excellent diagram of the water use of his island. In winter, the aquifers are filled up when fewer people are on the island, and only 35 m3 is used per day. Water usage in summer reaches 320 m3 per day. In winter and spring, as the snow melts and it rains heavily. Water tables typically hit their lowest point in late summer and early fall. In many areas, the yearly groundwater recharge is equal to the volume of the aquifers. Two years of drought can lead to severe scarcity – but it rains a lot on Koster.
There is enough groundwater in the islands as a whole. The problem is its unevenness in time and place. Without systems to share the water resources – mains and pumps – there is a great risk of scarcity in parts of the island.
The Koster islands score a 3.
References
- Banzhaf, S, Ekström, L, Ljungkvist, A, Granberg, M, Merisalu, J, Pokorny, S, & Barthel, R. 2017. Groundwater management in coastal zones and on islands in crystalline bedrock areas of Sweden. Geophysical Research Abstracts Vol. 19, EGU2017-9401, 2017.
- Barthel, R, Ekström, L & Ljungkvist, A. 2017. Combining scientific and societal challenges: a water supply case study from the Koster Islands, Sweden.
- Pleijel, C. 2016. Kosterbornas vattenförbrukning.
- Pleijel, C. 2017. Rapport: Alternativ 3.
Indicator 16: Water quality
a Rationale
The quality of drinking water refers to the chemical, physical and biological characteristics. The chemical indicators refer to, for example, pH, hardness, nitrate and pesticides. There are physical indicators such as temperature, conductivity and turbidity (transparency). The presence and amount of bacteria and viruses are examples of biological indicators.
b Definition
Water that is clean and safe to drink, based on laboratory tests.
c Computation
| 1 | 2 | 3 | 4 |
| There is no potable water on the island | There is potable water to a limited extent | There is enough water of good quality | More than enough water of good quality |
Regarding municipal water, you should be able to obtain data from the local waterworks, supplemented with interviews and media information on occasional or enduring problems. You have to conduct interviews or send out a survey for private water wells. Water quality can greatly differ in different parts of the island – near or far from the sea, near agricultural land – and in different seasons. If rainwater is frequently used, you need to understand what it is used for before judging its quality.
d Example
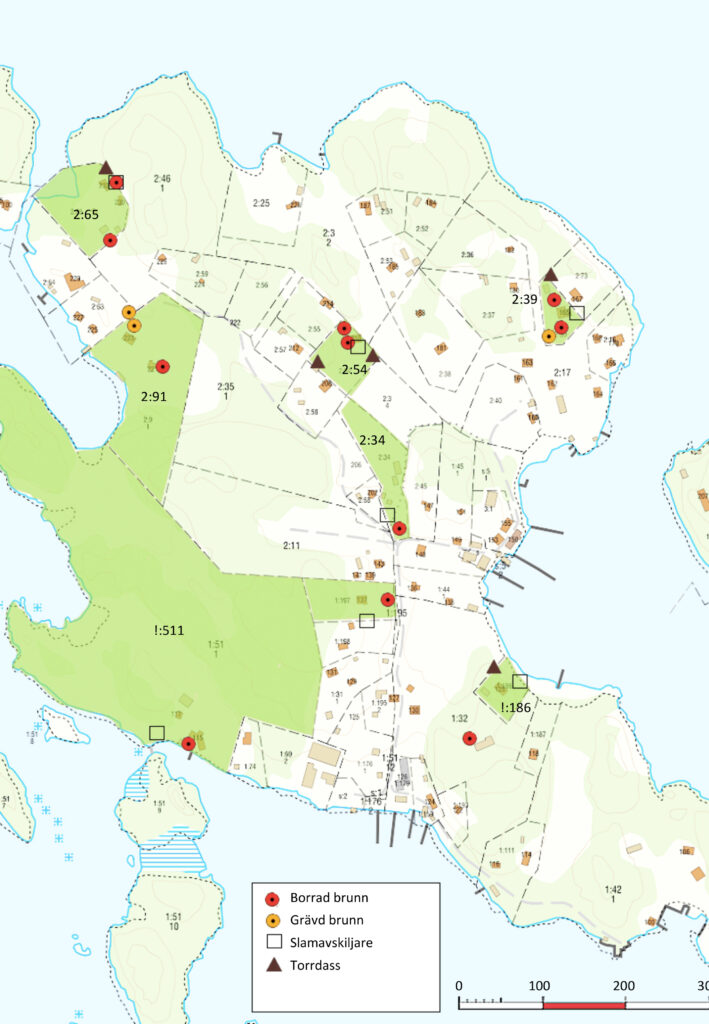
Norra Stavsudda is an island in the archipelago of Stockholm. It is 0.54 km2 in size, has 37 properties, and is an all-year home to 12 people, including a family with children. One hundred twenty part-time residents spend one to eight months of the year on the island. Visitors are mostly relatives of these residents. A study of water and sewage on the island showed that freshwater consumption for these people altogether was 1,197 m3 per year.
The island is not connected to a municipal water network. Each property has a drilled or dug drinking water well, which is the common solution in the Baltic Sea archipelagoes – everyone takes care of their own water resource. Just a few properties share their well with others.
A common problem on Norra Stavsudda is that the water tastes like iron, smells of sulphur, has a yellow-brown colour, and is salty. The reason for this is mainly due to the dynamic population situation. With a tenfold population increase in summer, the outtake from wells is too large, resulting in sinking water tables and saltwater intrusion, sometimes even intrusion from nearby sewage installations.
In August 2020, as part of the aforementioned study, most households decided to make a joint effort to analyse the quality of their drinking water. Water samples were sent to a laboratory and analysed for 40 different chemical, physical, and biological parameters.
Only six of the samples had potable water without remarks. Three samples were unfit regarding microbiological parameters. Most samples had potable water but with remarks concerning colour, hardness, turbidity, manganese and iron. One sample contained chloride, meaning saltwater intrusion into the well. Wells with potable water had plenty of water.
These tests gave the property owners the possibility to have the results for their own wells and an overall, anonymised picture of the water quality of the whole island. As a result, the islanders started to discuss the water situation of the entire island. They now seek technical, financial, and juridical solutions on how to share, develop and take care of the common water resource of their island.
The indicator value for Norra Stavsudda is 2.
References
- Ilao Åström, S. 2020. Brunnar och avlopp på Norra Stavsudda.
- Nordström, A & Pleijel, C. 2020. Vattensparandet sipprar från ö till ö.
Indicator 17: Water use
a Rationale
In Europe, agriculture uses the most water: around 40%. Energy production is also very water-consuming, with 28% of the annual water use predominantly used for cooling in nuclear and fossil-fuel based power plants and producing hydroelectricity. Mining and manufacturing account for 18% of water use, followed by households with around 12%. On islands, water use by agriculture and manufacturing is smaller, while tourism, often being the biggest industry, is a major consumer of water.
A range of factors influences water consumption: water availability, water supply options, climate (a warmer climate leads to greater water consumption), community size, economic level of the community, level of industrialisation, metering of household consumption, water cost, water pressure and system losses in mains and pipes (typically 25%).
b Definition
The yearly amount of freshwater used on the island.
c Computation
An island’s freshwater consumption can be measured from two sides: the consumer perspective and the producer perspective. It is wise to use both and then make a data confrontation, which will be explained below.
Let’s start with the consumers’ perspective. You will need data from indicator 4 (total population in person-days) to fill in the table below.
| Category | Person-days | Litres person/day | Sum |
| Residents (365 days) | m3 | ||
| Seasonal residents (90 days) | m3 | ||
| Visitors | m3 | ||
| Total human water use | m3 | ||
You can find figures on the national average of tap water use in your country on the webpage “Where Europeans Consume The Most Tap Water”. According to the “Water Saving Challenge” report on water consumption in small islands, it is reasonable to assume that resident islanders use 75% of the national average, summer residents 100% of the national average, while tourists use the European average, which is 150 litres/day. However, the hotel sector uses much more water than the general population, around 500 litres per guest and night.
Animals need water, of course. A goat consumes about 10 litres a day. Cows consume an average of 10 to 100 litres per day, depending on their age, sex, weight, and weather conditions. As mentioned above, 40% of the world’s freshwater supply is used for agricultural purposes. Farmers seldom use municipal water, but the municipal office should be able to give figures on agricultural and industrial use.
| Category | Sum |
| Human consumption | m3 |
| Agricultural use | m3 |
| Industrial use | m3 |
| Total freshwater use on the island per year | m3 |
Now, change to the producers’ perspective. How much water did the municipal waterworks produce in the same year as above? Please observe that 25% of the water produced is typically lost in leaks in the water mains. Schedule a meeting with your local water manager to get the figures for the table below.
| Sum | |
| Households | m3 |
| Businesses (hotels etc.) | m3 |
| Agricultural use | m3 |
| Industrial use | m3 |
| Municipal buildings | m3 |
| Total amount of water charged for | m3 |
| Water losses, percent of the above | m3 |
| Total amount of water produced | m3 |
If at this point you learn from the water producers that the island is importing water by mains or barges, or is producing water by desalination, you should note the amount of water that is not supported by natural water resources, and how this amount is related to population dynamics (indicator 5).
You should now be able to make a data reconciliation: the process of comparing data that has been derived from different surveys or other sources to assess and possibly improve their coherency, which is followed by an adjustment of the data to remove, or at least reduce, the impact of differences identified. It is not as complicated as it sounds; just a smart way of getting things right. You compare two data sources: the consumers’ and the producers’ perspectives. Adjusting them to each other should give you a more truthful image of your island’s water consumption than the use of only one data source.
Given the score of indicator 15, Water resources, it is now the time to judge if the water consumption of your island is in balance with your natural water resources.
| 1 | 2 | 3 | 4 |
| Freshwater is continuously overconsumed compared to natural resources | Freshwater is sometimes (seasonally) overconsumed compared to natural resources | Consumption is in balance with natural water resources | Water use is sustainable on a long term basis. |
d Example
Under indicator 14, we looked at precipitation on the island of Tilos. Let’s look at how they use their 703 mm of yearly rainfall. Tilos is made up of limestone – as a consequence, there is usually a rapid flow of water directly to the sea.
Consumer’s perspective
In Greece, the average daily water consumption rate is 125 litres per person per day, of which nine litres are used for food and drinking, 50 litres for bath and shower, 21 litres for dishes, 13 litres for washing, nine litres for other purposes and 25 litres for flushing the toilet.
The human water consumption on Tilos can be estimated to be 54,000 m3 per year. Of these 54 million litres of water, only four million litres are used for drinking (7%), over 21 million for baths and showers, and over ten million to flush toilets.
| Category | Person-days | Litres person/day | Sum |
| Residents (365 days) | 216.000 | 125 | 27.000 m3 |
| Seasonal residents (90 days) | 72.000 | 125 | 9.000 m3 |
| Visitors | 163.800 | 100 | 16.380 m3 |
| Campers | 40.500 | 40 | 1.620 m3 |
| Total human water use | 54.000 m3 | ||
Agriculture on Tilos is mainly sheep and the cultivation of olives. Agricultural use of water on Tilos is from 5-6 private boreholes for irrigation purposes, with small (5 m3/day) supplies that are not recorded. There are no industries on the island (except for tourism). Rainwater harvesting is not common.
| Category | Sum |
| Human consumption | 54.000 m3 |
| Agricultural use | 7.500 m3 |
| Industrial use | None |
| Total freshwater use on the island per year | 61.500 m3 |
Producer’s perspective
There are six municipal boreholes and two springs on Tilos. So far, there has been no need to desalinate or import water. But as the human pressure caused by tourism becomes more and more uneven – peaking in summer when the need for water is 250 m3/day (compared to 75 m3/day in winter) – the boreholes are at risk for saltwater intrusion.
Leakages are huge; only 40% of the water produced reaches the consumers. Therefore, water production must be 250% larger than the water used to deliver 54.000 m3 of freshwater a year, thus 136.000 m3 a year.
For indicator 17, Tilos is on level 2.
References
- Statista. 2019. Where Europeans Consume The Most Tap Water.
- Pleijel, C & Nordström, A. 2018. Water Saving Challenge – a smart guide to water management.
Indicator 18: Sewage and effluent
a Rationale
We drink the same water the dinosaurs drank. The water we use today will be reused by others in the future. Earth’s water is not consumed; it is borrowed in an eternal cycle. We use it, contaminate it, clean it, and reuse it again.
Sewage is also referred to as wastewater from kitchens, toilets, or surface water, while effluent is water from industry and agriculture. Sewage has many forms: greywater from sinks, bathtubs, showers, dishwashers and washing machines, and ‘blackwater’, which is water that has come in contact with toilet waste and must be treated and disinfected before resuing. An individual produces 1–2 litres of urine per day, of which 95% is water, and the rest is urea, sodium, chloride, drug residues, etc. The amount of faeces varies more individually, but 400-500 grams per person per day seems to be an average, i.e. 127 kg/year /person.
Sewage can also come from irrigation and water runoff from streets, parking lots, and roofs. It can contain nutrients (nitrogen and phosphorus), solids, bacteria and viruses, oils and fats, heavy metals including mercury, cadmium, lead, chromium, copper and many toxic chemicals including PCBs, PAHs, dioxins, pesticides, phenols, chlorinated organic substances, microplastics, and drug residues. Before returning this contaminated water to the natural cycle, we clean it in individual sewers, with small communal facilities, through industrial treatment processes and in larger municipal treatment plants, all of which are carefully regulated by law.
Islands have difficulties managing their sewers. The large proportion of holiday homes and tourists results in greater production of sewage per capita than in cities. Great variation in human presence results in uneven, seasonal sewage production. It is difficult to build well-functioning treatment plants for both small-scale winter use and ten times larger volumes in summer, which leads to technical, economic and environmental challenges.
b Definition
The level of treatment that the island’s private and communal sewers, business facilities and municipal systems achieve.
c Computation
| 1 | 2 | 3 | 4 | ||
| No control, no numbers, no one knows how it really is | Some control, known deficiencies and discharges of untreated sewage | Regular inspections, mostly works well, deficiencies under heavy load | Regular inspections, a well working system of good capacity | ||
| Private sewers | |||||
| Common sewers | |||||
| Sum for households | |||||
| Industry | Shipyards | ||||
| Laundries | |||||
| Hotels & Restaurants | |||||
| Construction | |||||
| Other | |||||
| Sum for industrial sewage | |||||
| Municipal treatment plant | |||||
| Sum for municipality | |||||
Sum of households + industry + municipality / 3
d Example
Möja is an island in the Stockholm archipelago, or actually, two islands: Big Möja and South Möja, surrounded by smaller islands called the Möja archipelago. The land area is 13 km2, and the number of all-year residents is 250 in 140 households. In summer, there are 600 households, and the island has 25-27,000 visitors between June and August. Hostels, guesthouses, private rental cottages, and two restaurants are open all year round, plus 3-to 4 more restaurants open in the summer, and a shipyard.
In 2019, two students from Uppsala University wrote their master’s degrees on the water supply and sewage treatment systems on Möja. The number of personal days spent in this archipelago is 267,300 (267,300 / 365 = 732 persons), resulting in urine being between a quarter and a half million litres per year. The amount of faeces is about 93 tonnes per year.
260 of the 740 households in the Möja archipelago are connected to municipal sewers, and the rest have individual solutions. Möja belongs to Värmdö municipality, where there are a total of 15,000 individual sewers. In 2015, 60–70% of these sewers did not meet the municipality’s treatment requirements, which is why supervision of small sewage systems in the archipelago was started and has been ongoing.
An overall assessment of the sewage management on Möja gives the following results:
| 1 | 2 | 3 | 4 | ||
| No control, no numbers, no one knows how it really is | Some control, known deficiencies and discharges of untreated sewage | Regular inspections, mostly works well, deficiencies under heavy load | Regular inspections, a well working system of good capacity | ||
| Private sewers | 2 (before 2025) | 3 (after 2025) | |||
| Common sewers | |||||
| Sum for households | 2,5 | ||||
| Industry | Shipyards | 4 | |||
| Laundries | |||||
| Hotels & Restaurants | 3 | ||||
| Construction | |||||
| Other | |||||
| Sum for industry | 3,5 | ||||
| Municipal treatment plant | 4 | ||||
| Sum for municipality | 4 | ||||
Möja archipelago as a whole: (2,5 + 3,5 + 4) / 3 = 3.
Addition
Located on the main island of Möja, fisherman Rune Wikström and his family started a restaurant many years ago. Rune gets up early almost every day of the year, meets his tame trout in the harbour, goes fishing and returns in the morning with the day’s catch, which is cooked and served in the restaurant. The restaurant periodically lacks freshwater as its three wells run dry in summer. The family decided that they could not afford to let the guests use freshwater to flush the toilets and referred them to a very well maintained outdoor toilet in the garden. Alas, many people did not find this charming or even acceptable.
To solve this, the municipality allowed Wikströms to pump purified water from the village’s wastewater facility, located one hundred metres from the restaurant, provided separate pipes for wastewater were installed. This purified water was then used for flushing the toilets in the restaurant. This unusual and well functioning solution has been broadcasted on national television; however, there are still people who cannot accept the use of wastewater – not even for flushing toilets. A survey conducted among the permanent residents showed that many accept the reuse of greywater, but only a few accept that blackwater is reused.
References
- Johansson, M. 2020. Pelagos Avloppsatlas: Fosforöverskott och ökad risk för övergödning.
- Adelsköld, S & Ilao Åström, S. 2019. Vattentillgång, vattenanvändning och inställning till återanvändning av renat avloppsvatten på en ö i skärgården – en fallstudie om Möja. Uppsala universitet.

The Habitability Handbook – An assessment tool for viable island communities by the Archipelago Institute at Åbo Akademi University is licensed under Creative Commons Attribution-NonCommercial-NoDerivatives 4.0 International License.